Disclaimer: The above statements and views are those expressed by the team members of group 5 and do not reflect those of the University of Southampton or the National Oceanography centre staff or other students
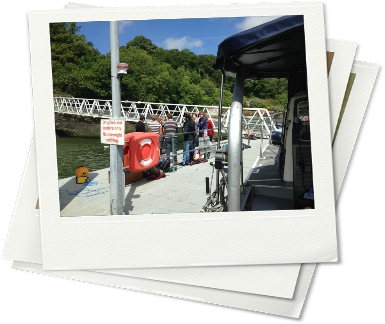
Pontoon
Date: 29/06/2015
Time: 07:15-11:00 UTC
Location:
50 12’57.76’’N 005 1’39.65’’W
Low tide: 09:13 (UTC) 1.20m
High tide: 15:10 (UTC) 4.60m
Weather:
7/8 cloud cover, strong southerly breeze, calm sea state.
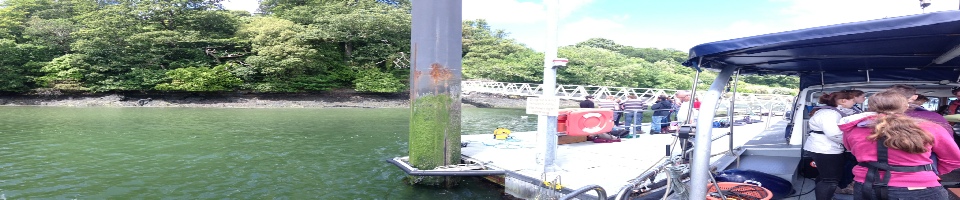
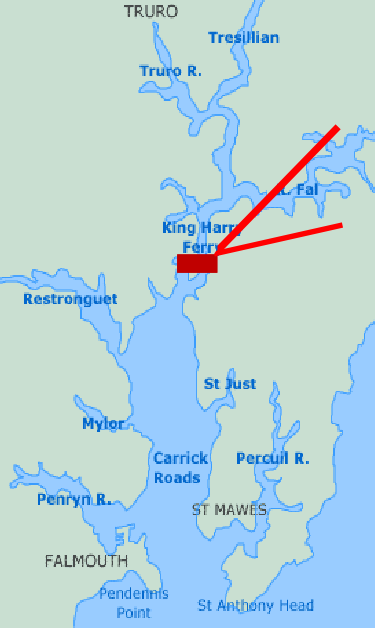
The King Harry Ferry pontoon is situated adjacent to the chain ferry, at the foot of the extensive gardens of Trelissick House at 50°12'57.76"N 005° 1'39.65"W.
The pontoon itself is predominantly used for the enterprise ferry company and is situated offshore slightly allowing it to be a perfect position for a time series analysis of certain physical and biological parameters. Over a two and a half hour time period a series of readings were taken at 30 minute intervals for later analysis. The measured parameters allowed us to see how tide effects the surrounding areas physical and biological features.
On the pontoon we were taking a range of oceanographic parameters including: current, depth, salinity, temperature, turbidity, pH and oxygen saturation. These measurements were taken every thirty minutes starting at 08:30 UTC and ending at 11:00 UTC. By sampling every half an hour and at the same position, it enabled us to produce an accurate time series in order to show the effect that tide has on the parameters we were measuring. Over the time period recorded in the morning the tide reached its lowest point of the day, ebbed and began to flow back up the estuary. Therefore our data was limited to a shallow 3.3m at its maximum.
Methodology
A range of equipment was used in order to collect the wide range of parameters wanted.
A light metre (for measuring light attenuation ) was firstly deployed to check the maximum depth; this information was conveyed to the rest of the team allowing them to record to suitable depths so as to not affect or damage the sensors. To measure light attenuation throughout the water column the light metre was placed into the surface water and a reading was taken. From then, at metre intervals the light attenuation was recorded to the seabed.
A YSI probe was used to measure salinity, temperature, turbidity, pH and oxygen saturation. It was placed into the water column and allowed to stabilise before readings were taken at metre intervals; the parameter reading were noted down in the log book. We stopped half a metre from the bottom each time as the bed can damage and affect the sensor.
The current metre (tow fish) was placed into the water column just below the surface and allowed to stabilise before it was lowered once again a metre at a time. The tow fish measure the currents velocity and direction. The seabed does not affect this instrument and therefore it can be rested on the seabed allowing a bottom current to be measured.
Chlorophyll samples were taken by the same method as offshore. This is done by taking a 500ml sample of surface water and using a syringe to filter across a small membraned filter paper. The filter paper is then placed in a test tube containing a small quantity of acetone and stored for the lab work.
At several times during the morning the ferries and leisure boats came alongside the pontoon. We used the other side of the pontoon to the main docking side therefore we didn’t have to retrieve instruments or move position to avoid vessels making our data a reliable time series. However, the movement of these vessels could have affected the reading of the current and also produced turbulence throughout the water column affecting other parameters. As we only sampled in the morning the tide changed marginally from being at low water to the start of incoming tide. In order to gain a full understanding of how the tide effects these parameters, we would need to use other group’s data from afternoon sampling on the same day to produce the full timescale.
Results
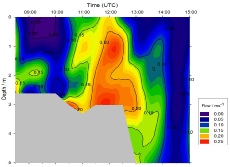
Current speed
The graph shows that there is a clear period of approximately two hours in the middle of the day where the current speed is fastest due to the tide coming in after the low tide. At the beginning of the day the flow is slow because the tide is ebbing. The current slows down in the afternoon as high tide is approaching meaning the greatest movement of water has occurred.
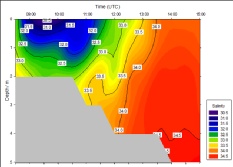
Salinity
There is a clear uniform structure which shows that as the day progresses salinity also increases. Surface water in the morning has the lowest salinity ranging from 30.5 to 31.5. The greatest depth sees the largest salinity of 34.5. In the afternoon from around 13:20 the water column becomes more homogenous and there is little change between surface and deep water measurements. This is due to an incoming tide, bringing a flux of saline water forcing the denser water up into the estuary and subsequent rivers.
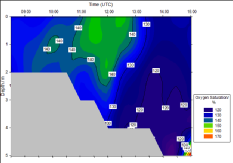
O2 saturation
Oxygen saturation increases from 11:00 to 13:00. Oxygen saturation can vary significantly during the day and night particularly during spring and summer due to activity from algae. Photosynthesis from algae during the day would increase the levels of oxygen in the water column. At around 13:00 cloud cover increased and the wind speed increased to 16 knots.
The rate of photosynthesis would have decreased reducing the oxygen saturation levels.
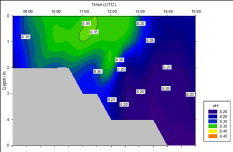
pH
The pH in the pontoon shows a clear trend of increasing as the morning progressed, then decreasing from 13:00. Surface waters tend have a higher pH compared to deeper water. There is a very minimal difference of approximately 0.15. The slight change could be due to the ebbing tide therefore a greater riverine input which could slightly affect the pH.
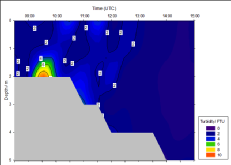
Turbidity
Greatest turbidity is found at 2.3m between 09:25 UTC and 09:54 UTC. Low tide was at 09:10 UTC with the location of the pontoon up the estuary the turbidity maximum can be explained by the change from lull tide to ebb tide. The depth of the turbidity maximum is due to turbulence caused by the water column interaction with the seabed. The seabed beneath the pontoon is mostly mud and silt due to low energy level of the estuary. This will result in high levels of turbidity. Turbidity remains low for the rest of the time series. Any high levels recorded at the surface are approximate hourly and coincide with the ferry times; which causes turbulence due to their props and wake.
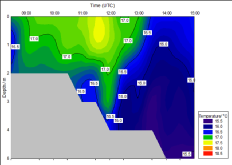
Temperature
The highest temperature were recorded in the surface layers between 09:00 and 13:00. The maximum temperature 17.5 degrees was recorded at 11:30 (UTC). This was to be expected as it was the hottest part of the day. Tidal mixing would cause the water body temperature to become more homogenous, and slightly cooler with the incoming sea water. Also there was a steady breeze throughout the day which would have caused some mixing of the surface water.
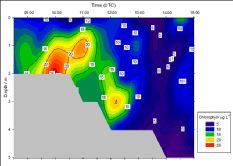
Chlorophyll
Three samples were taken each time up to 11:00, when it changed to 4 samples every 30 minutes. This increases to 5 samples at 12:00, then 6 samples every 30 minutes at 14:00. There is a maximum chlorophyll concentration of 25.64 µg/L at 2m at 10:00. While the lowest concentration was 3.45 µg/L at 5m at 14:30. Chlorophyll concentrations above 10 µg/L only occurred before 13:00, apart from 14.68 µg/L (0m at 14:30) and 10.5 µg/L (1m at 15:00).