Disclaimer:The above statements and veiws are those expressed by the team members of group 5 and do not reflect those of the University of Southampton or the National Oceanography centre staff or other students
Estuary Physics

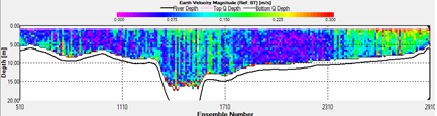
ADCP
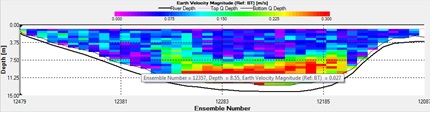
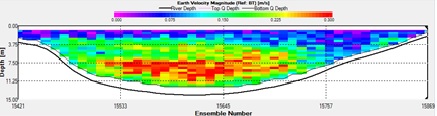
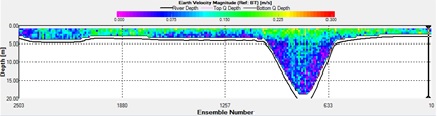
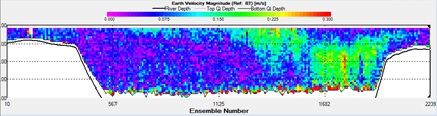
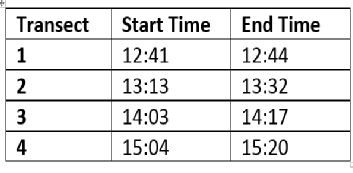
On the day of sampling the tidal range was 3.40m and the state of the moon was waxing gibbous. Low water (1.20m) was at 09:13 utc and high water (4.60m) was at 15:10 UTC. As well as the tidal flow, the water movement in the estuary is governed by complex estuarine bathymetry and riverine inputs. Significant precipitation was observed in the morning on the day before sampling suggesting a higher than usual riverine input. The previous group collected two ADCP transects upriver of the pontoon, both show a strong flow as a result of the flood tide in the deeper navigational channel. The last transect taken by the previous group shows the strongest flow velocities of 0.329 ms-1 and a net flux of 290 m3 s-1. No data was collected for transect 1. Transect 2 was taken at mid tide, when the tidal flows were at their fastest. The entire transect flows in a uniform direction with a net flux of 760 m3 s-1 and flow velocities reaching 0.236 ms-1.On transect 3 flow speeds reach 0.311 ms-1 in the navigational channel where the water column is at its deepest. A small flux of backflow, presumably resulting from the input of the Truro River, was observed along the shallower eastern side of the estuary. Transect 4 was taken at high water. There is a small tidal flow of water into the estuary sandwiched between two outgoing riverine water masses. There is a net flux of 190 m3s-1 seaward. These transects provide a tidal analysis of the flood tide into the Carrick Roads and propagation up the Truro river.
Transects (UTC)
Location
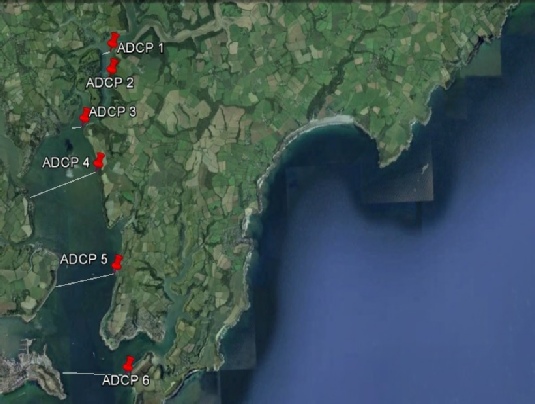
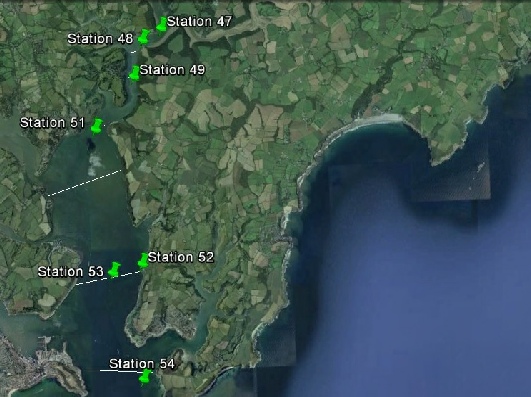
Figure 1 A: Location of ADCP transects taken from the Fal River moving towards the Carrick Roads. B shows the stations sampled within the river and the estuary. For Latitude and Longitude see estuary homepage.
A
B
2.1
2.5
2.4
2.2
2.6 6
Figures 1-6: Images of the ADCP data collected at the respective sites. ADCP 3 failed to save correctly and so data is absent for this site.
Temperature/Salinity Diagrams
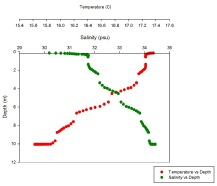
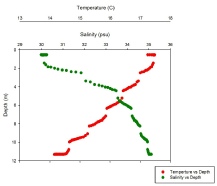
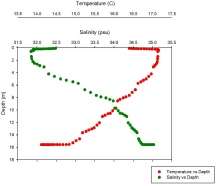
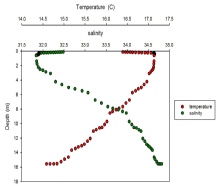
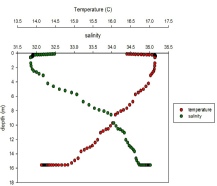
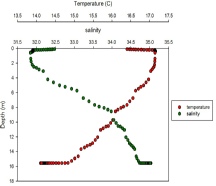
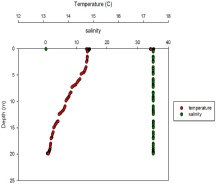
At the top of the estuary within the Fal River include the first four stations which all show similar patterns of temperature change with depth. There is a linear steady decrease from approximately 17.2’C to 15.9’C. This is due to solar heating as water takes a long period of time to significantly change in temperature. From the final 4 stations which we collected in the Carrick roads moving closer to the mouth of the estuary the temperature profile continues to follow the same pattern. However station 54 at Black rock has a deviation from this pattern. The linear profile is similar however due to cooler conditions and a persistent cold wind the surface temperature was slightly lower than the upper estuary.
Salinity profiles for all stations except from 54 follow a similar pattern in increasing from approximately 32 to approximately 34.5 towards the seabed. This is due to the riverine input of freshwater
Forming a layer of less dense fresher water lying above the more dense saline water. At station 54 there is a deviation from this pattern showing extremely minimal change from surface waters to depth of 20m. Station was located at the mouth of the estuary and therefore experiences a stronger degree of mixing than the upper estuary.
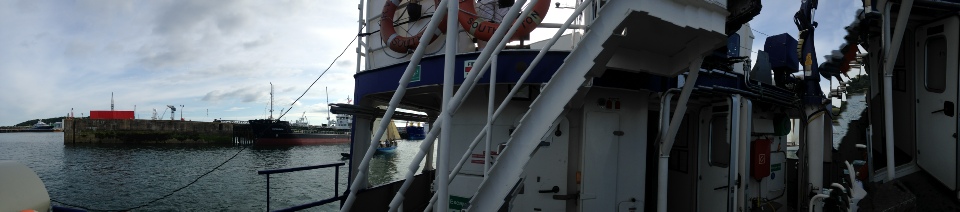
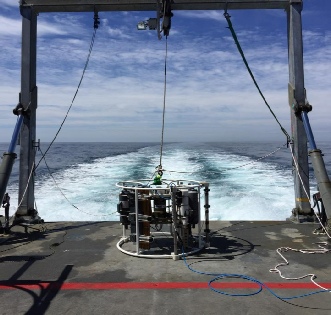
Figure 3: CTD rosette on the stern of Bill Conway.
Figure 4.1-4.7: Temperature vs salinity vertical profiles in the water column for stations 47,48,49,51,52,53 & 54. Roll over each graph for an enlarged view.
47
52
53
54
51
49
48
Richardson’s Number
Velocity profiles were obtained from the ADCP and density profiles were obtained by from temperature and salinity CTD data. Richardson numbers were calculated at every 2m depth interval to obtain an interpretation of the turbulent behaviour of the estuarine water column.
All stations show a trend of turbulence in surface layers (between 0-2m), with laminar flow forming with increasing depth in the centre of the water column. Approaching the seabed, flow becomes turbulent once more, as friction from the seabed creates shear.
As a result of the complicated density variations arising from the riverine and oceanic water masses in the estuary, the Richarson’s number appears to fluctuate significantly at each station. (Abarbanel, 1984)
The stations all differ slightly in the depth at which the state of flow changes, but the pattern remains the same. The exception to this is at Station 53, where flow is laminar at the seabed because it is the location of the biggest degree of stratification.
Abarbanel, H. e. (1984). Richardson Number Criterion for the Nonlinear Stablility of Three-Dimensional Stratified Flow. Physical Reveiw Letters, 2352.
References
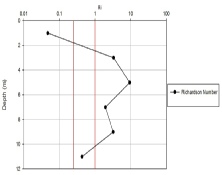
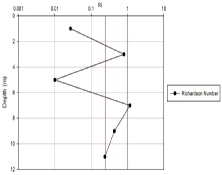
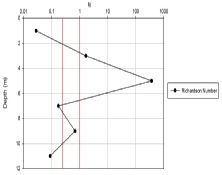
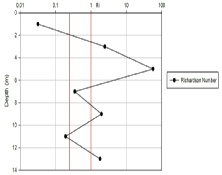
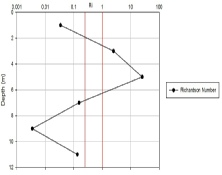
Figures 5.1-5.5: Richardsons Number change with depth for stations 48, 49, 52, 53 & 54.