Disclaimer: The above statements and views are those expressed by the team members of group 5 and do not reflect those of the University of Southampton or the National Oceanography centre staff or other students
Offshore Biology
Zooplankton
As can be seen in Figure 1 the highest concentration of zooplankton was observed, 7550 organisms per m-3, at Station 12 between 20-30m with the highest range of biodiversity. Station 12 was our compulsory station near to the shore as can be seen on the map. Copepods and Cladocera have dominated the population. The water column being near shore is an ideal nursery ground for larvae resulting in a high number of polychaete larvae. Station 5 was also near shore and had the second largest concentration of zooplankton, 3800 organisms per m-3.
Station 5 organism biodiversity mimicked station 12 on a smaller scale with large concentrations of Copepods and Cladocera. Hydromedusae were found in large numbers at Station 5 due to an influx of cnidarian to the surrounding waters in recent years.
Station 7 was the furthest sampling site offshore. The composition and population of zooplankton reflects this with high numbers of Copepods and Cnidaria which are mobile species allowing them to move within the water column and remain stable in the water column despite tidal flows. Phytoplankton are low at this station from 9-25m due to grazing from the high divrse zooplankton population.
Station 11 sees a much lower abundance of zooplankton – this sampling site was taken from a transect moving offshore to inshore, Station 7 to Station 12 – see map. Across this transect the tidal mixing front was located with a deep chlorophyll maxima occurring 24-27m deep in the water column. Zooplankton were present in their lowest abundance, <1000 per m-3. We expect this is due to a lag between phytoplankton bloom and grazing.
Across all of the sampling stations zooplankton were most abundant between 30 and 20m with few species seen toward the surface of the water column due to the high phytoplankton numbers beneath the surface as a result of the tidal mixing front. Zooplankton location mimics that of their prey.
Phytoplankton
Along with the chlorophyll maximum in the frontal system a dinoflagellate bloom was observed dominated by Ceratium furca, figure 2. The frontal system was first observed at station 8 and continued to station 11, by 12 it was absent. The dinoflagellate bloom is representative of this which occurred due to the warm, slow moving eutrophic water of the summer months allowing for nutrient accumulation. Ceratium furca are motile mixotrophs with large complex genomes to code for both photosynthesis and mobility. They form algal blooms in the water column which lead to a reduction in edible phytoplankton for zooplankton to graze on explaining the low population abundance in zooplankton at station 11. Zooplankton samples at stations 9 and 10 would have aided this explanation but were not collected.
Ceratium furca grow with the disappearance of diatoms, (Yurimoto and Tatsuya et al, 2015). Within the frontal system the dinoflagellates dominate. With the decline of the front near shore at stations 5 and 12 the dinoflagellates bloom disintegrates and diatoms are the majority species. This may be due to a prior diatom bloom, however we were not in the field to observe this.
Stations 5-7 see a large biodiversity of phytoplankton with depth in the water column. Phytoplankton numbers are low <20 per ml-3. Ciliates are present in the surface waters whilst dinoflagellates can be found down to 30m. The low phytoplankton count at station 7 is due to the depth of sampling, light attenuation reached 13.7m and so no phytoplankton could photosynthesise below this depth – the few observed are due to the start of the deep chlorophyll maximum. Few silicoflagellates are found at any of the stations due to declining silicon concentration from station 12. The station nutrient profiles show silicon concentration to be low and therefore these species are under nutrient limited conditions.
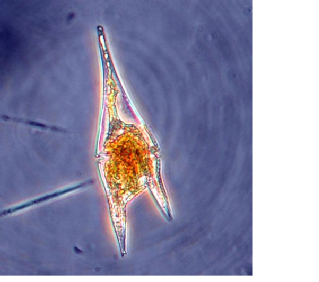
Figure 3: Dinoflagellate Ceratium Furca
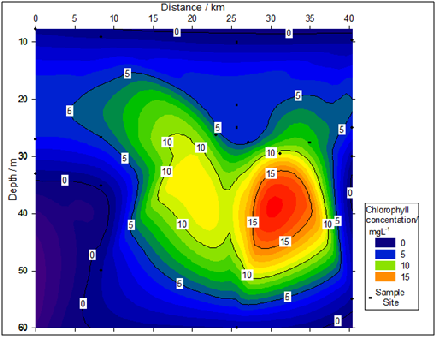
Chlorophyll
A chlorophyll maximum is observed between 20-30m across all sampled stations with a maximum peak of 17.64 at station 10 at a depth of 27.5m in the midst of the maximum and the front. The Chlorophyll maximum occurs at 20-30m due to a lagged response to high concentrations of silicon, phosphate and nitrogen from 9-26m, resulting in high primary production. Chlorophyll was depleted in the upper 10m of the water column with a maximum of 0.912 mgL-1 at 9.7m at station 7and a minimum of 0.492 mgL-1 at station 5 due to nutrient depletion, see chemistry. As depth increases below the chlorophyll maximum, concentration rapidly decreases to 0.5652 mgL-1 by 50m at station 12. The lack of light penetration at this depth means phytoplankton growth is inhibited limiting the chlorophyll concentration. There is a slight increase from 0.5652 mgL-1 to 0.9168 mgL-1 at 60m at station 6 which may be as a result of mixing in the water column from layers in the euphotic zone as levels are present but extremely low. The chlorophyll maximum had different concentrations at similar depths for different stations with the highest observed at stations 9 and 10 which were in the midst of the tidal front. The phytoplankton graph shows the large dinoflagellate bloom at these locations which is a consequence of the front and the reason for the high chlorophyll. Station 5, 7 and 12 had a range of 3.168 mgL-1 to 5.304 mgL-1 from 25m to 27m which was less than the transect stations showing the tidal front introduced at station 8 moving toward the shore with chlorophyll accompanying.
Figure 1: Zooplankton population per ml-3 displayed by species at each sampled station. Rollover to enlarge.
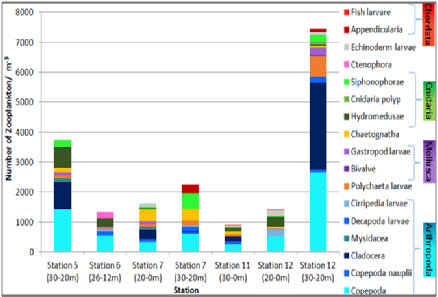
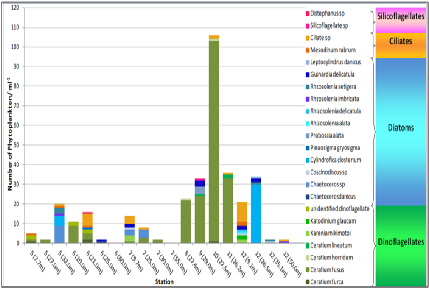
Figure 2: Phytoplankton population per ml-3 displayed by species at each sampled station. Rollover to enlarge.
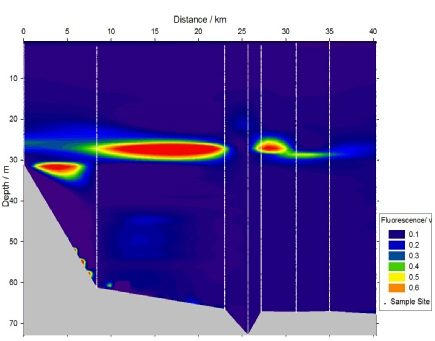
The majority of the water column has low fluorescence values (<0.1v), figure ,showing that there is low phytoplankton growth in these areas. The phytoplankton population per ml-3 is low in the corresponding stations, figure 2. The highest fluorescent values (>0.01v) correspond to the chlorophyll maximum and the presence of the thermocline between 20-30m where the highest phytoplankton abundance is evident, figure 2.
Fluorescence
Figure 4: Chlorophyll concentration (mgL-1) with depth at each sampled station. Distance is relative to station 5, 0km. Sample sites are identified at each depth sampled as shown in the legend. Click for alternate graph.
Figure 5: Fluorescence with depth at each sampled station. Distance is relative to station 5, 0km. Sample sites are identified at each depth sampled as shown in the legend. Rollover for enlarged view.
Dissolved Oxygen
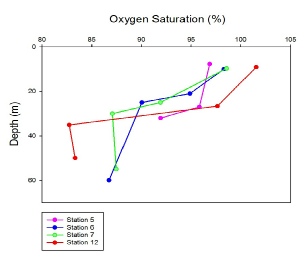
Percentage oxygen saturation was obtained using Niskin bottles at all stations, with only one sample being taken at stations 8-11. All other stations had profiles taken, and are included in the profile graph. Overall, oxygen saturation decreased with depth. Station 6 started to rapidly decrease in saturation from 21m to 25m (95.20% to 90.08%). The saturation rapidly decreased at Station 7 from 25m to 30m (92.09% to 86.56%). Station 12 decreased rapidly in saturation from 26.65m to 35.09m (98.64% to 81.40%). Station 5 decreased rapidly in oxygen saturation from 27m to 32m (96.55% to 90.6504%). All of these rapid reductions in saturation coincide with peaks in chlorophyll for the profile stations; this is due to large abundance of zooplankton communities at these depths feeding on the phytoplankton, which utilise the oxygen.
Figure 6: Oxygen Saturation vertical profile for all sampled stations.
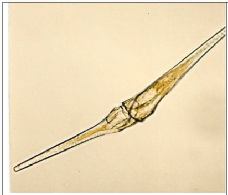
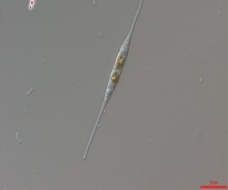
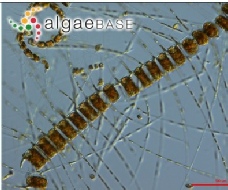
Images of Dominant phytoplankton species:
Left: Ceratium fusus
Centre: Cylindotheca closterium
Right: Chaeotoceras danicus
Click for website
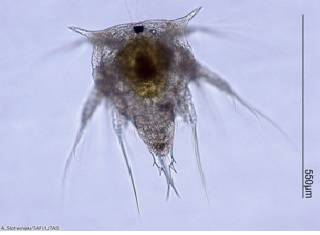
Dominant observed zooplankton species
Left: Cristacean naupalii
Right: Lensia multicristata
Click for website with information regarding species.