Disclaimer: The above statements and views are those expressed by the team members of group 5 and do not reflect those of the University of Southampton or the National Oceanography centre staff or other students
Estuary Lab Analysis
Conservative behaviour is when a solutes concentration is determined by the extent of mixing between marine and riverine end-members. This occurs when a solute is not added or removed from solution by particle/solution reactions and is not added from additional source.
During the time series the tide was flooding therefore increasing sea water influence which is more nutrient limited, this explains the reduction in all parameters with increasing salinity.
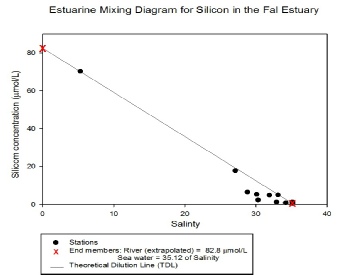
Silicon
The graph shows that Silicon is removed in the estuary, there was a high abundance of diatoms found. These utilise Silicon for structure by creating tests. Silicon normally behaves in a conservative manner therefore the behaviour mostly likely to be explained by the bloom. The removal of Si is greater in areas with improved mixing (Roubeix, Rousseau, Lancelot, 2008). This explains the decreased concentration further down the estuary where salinity is higher and mixing is greater. Silicon concentrations are high compared to a UK average this is most likely due to the catchment area being largely granite, an Si rich substrate and the head of the estuary has a high volume of riverine input.
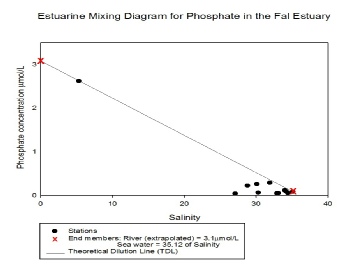
Phosphate
The graph suggests that several of the stations have conservative phosphate behaviour as the points are close to the theoretical dilution line (TDL). These are more likely to be from the stations furthest up the estuary as riverine inputs are a more dominant source of phosphate. The other points on the graph shows that phosphate is being removed, this trend is probably due to the primary production. However, the data still appears to be fluctuating which makes the description of a possible pattern not very precise. A reason for this could be human error when measuring.
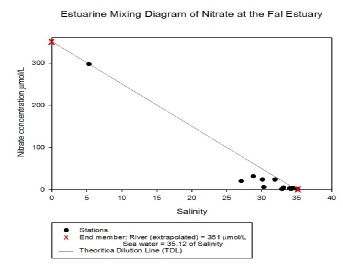
Nitrate
Nitrate and phosphate display similar patterns which is to be expected due to the nature of the way that both parameters are utilised by organisms within the estuary. Estuaries are known to be large reactive nitrogen sinks, removing up to 50% from the water column during transport to the sea (Dahnke, Bahlmann, Emeis, 2008) . It is known that the nitrate-phosphate ratio of 16:1 on the open ocean does not apply for estuary due to the very sources of these nutrients and primary activity. Therefore, the ratio on this estuary was expected to be different, but it is very high ratio of approximately 100:1, this most likely due to high human impacts from previous heavy mining and surround large scale agriculture.
Estuarine mixing diagrams
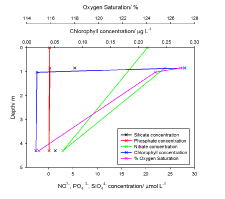
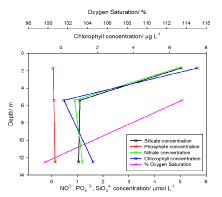
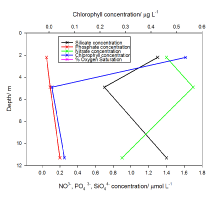
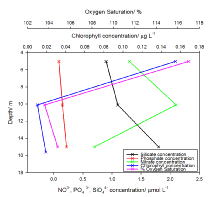
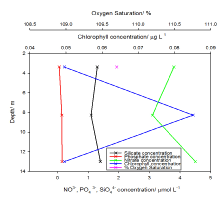
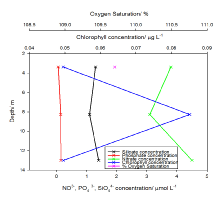
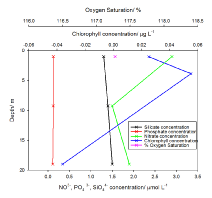
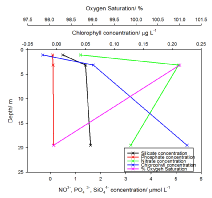
Nutrient vertical profiles
Figures 3.1-3.8: Nutrient profiles of Nitrate, Silicon and Phosphate with depth for stations 47-54. Chloropphyll and dissolved oxygen have been included for refrence but are discussed under biology.
Figure 2.1-2.3: Estuarine mixing diagrams for Silicon, Phosphate and Nitrate in the Fal estuary. Red crosses mark the riverine end member and the salt water end member respectivley.
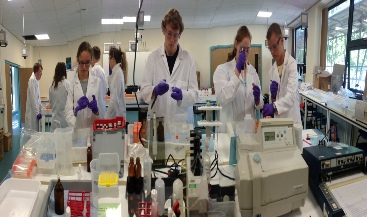
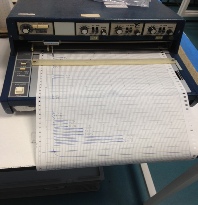
Figure 1: Group 5 analysing phosphate samples for the Fal estuary
2.1
2.3
2.2
3.8
3.7
3.6
3.5
3.4
3.3
3.2
3.1
Chlorophyll
Chlorophyll measurements were taken at three different depths at each of the 8 stations (stations 46, 47, 48, 49, 51, 52, 53 and 54). Stations, 47, 48 and 49 only have two values at each station. Station 53 only had two values at 3.87m and 19m, and station 54 had only two values at 1.04m. Stations 52, 53 and 54 have two very shallow depths (1.17m, 3.87m; 1.04m, 3.87m; 1.04m and 3.1m respectively), which match the low concentrations of station 51. The lowest of these concentrations being -0.036 mgL-1 at stations 52 and 53 (1.17m and 1.04m depth respectively), while the highest was 0.03816mgL-1 at station 54 (3.1m depth). There are very shallow depths are stations 46, 47, and 48(0.84m, 1.02m; 1.7m, and 2.2m respectively). At station 46, low concentrations of chlorophyll were measured at 1.02m (0.02688 mgL-1, 0.01728 mgL-1 and 0.01044 mgL-1). Thus station 46 is similar at shallow depths to stations 51-54 in terms of chlorophyll concentration. However at 0.84m, station 46 had higher concentrations of 0.66 mgL-1 and 0.162 mgL-1.
These higher chlorophyll concentrations are also seen at 1.7m at station 47 (0.4932 mgL-1 and 1.308 mgL-1), and at 2.2m at station 48 (1.0344 mgL-1). From 4.3m-5.4m at stations 46, 47, 48 and 49 (with depths at 4.3m; 5.4m; 4.9m and 5.03m respectively) chlorophyll concentrations ranged from 0.0084 mgL-1 to 0.04008 mgL-1. With the minimum concentration being at station 46 at 4.3m, and the maximum concentration being at station 49 at 5.03m. This concentration range is similar to the concentration range at stations 51, 52, 53 and 54, at similar depths. Station 49 also had an especially high concentration of 0.27 mg L-1 at 5.03m, in relation to the overall data collected at a depth of 3-5m. Station 54 had a high concentration of chlorophyll at 19.5m (0.1344 mgL-1 and 0.3168 mgL-1), similar to 0.3864mgL-1 and 0.03744 mgL-1 at 12.5m, station 47. These high chlorophyll concentrations are in stark contrast to the rest of the data below 8m (range of -0.036 mgL-1 to 0.11544 mgL-1).
Dissolved Oxygen
During the morning estuary session a group took readings further up the estuary towards Truro recording at stations 46, 47 and 49; three readings were taken at both stations 46 and 49 respectively whereas at station 47 only two readings were taken. In the afternoon session single dissolved oxygen samples were taken at stations 51, 52 and 53, with station 54 having two dissolved oxygen samples taken. From the Figure 1 we can see that in all cases as depth increases oxygen saturation decreases. This could be due to the greater oxygen exchange at the air sea interface and the respiration of organisms within the water column depleting the oxygen. We can also see a trend with surface oxygen saturation decreasing with stations closer to the estuary mouth.
References
Dahnke, K. Bahlmann, E. Emeis, K. . (2008). A nitrate sink in estuaries? An assessment by means of stable nitrate isotopes in the. Limonology and Oceanography. 3 (4), 1-3.
Roubeix, V. Rousseau, V. Lancelot, C. (2008). Diatom succession and silicon removal from freshwater in estuarine mixing zones: From experiment to modelling. Estuarine, Coastal and Shelf Science. 78, 14-26.