Disclaimer: The above statements and veiws are those expressed by the team members of group 5 and do not reflect those of the University of Southampton or the National Oceanography centre staff or other students
Geophysics
Date: 25/06/20157
Start Time: 07:00 (UTC)
End Time: 12:20 (UTC)
Transect Location:
Between:
50 05’85N, 005007’20W and 50005’69N, 005006’20W
Low tide: 07:09 (UTC) 1.80m
High tide: 13:06 (UTC) 4.20m
Weather:
7/8 cloud cover, force 2 sea state, SW wind 8kts.
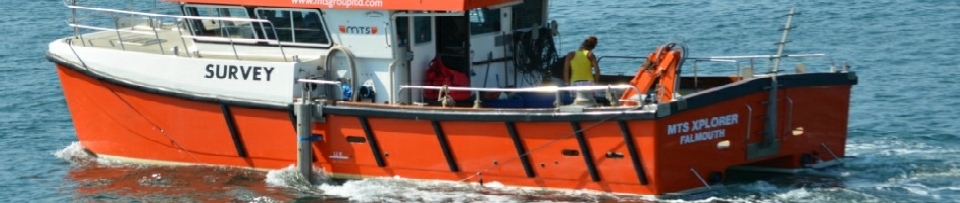
Vessel: MTS Xplorer
Introduction
Famous for its association with smuggling, the Helford estuary is located within the Falmouth Special area of conservation (SAC) which extends from St Antony lighthouse across Falmouth bay to the Lizard. On the 25th June 2015 between the hours of 8:00 and 12:00; within the Helford River 4 transects were taken using side scan sonar to give a detailed image of the seafloor; from this two positions were chosen for a video survey to allow a more detailed analysis of the seabed, its fauna and its bedforms. All of this data was recorded while aboard the MTS Xplorer, a highly manoeuvrable high speed fastcat used for scientific surveying.
Methodology
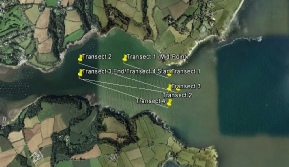
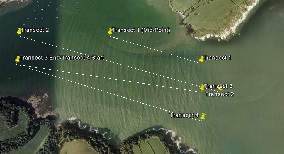
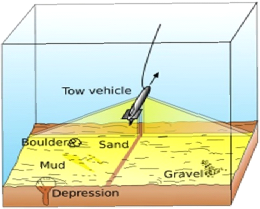
Side scan is a method whereby a specialised acoustic survey instrument is towed behind the vessel at the depth of approximately 1m; this depth is kept constant throughout the survey to allow a greater swath range to be recorded. We were able to record detailed imagery of the seabed 75m either side of the vessel using the tow fish. It uses acoustics to produce a map of backscatter showing outlines of bedforms, shown in figure 1. Four transects were recorded; starting at the mouth of the northern shore of the Helford River westwards, upriver. Each subsequent transect was slightly further south therefore incorporating most of the width of the river within the survey; shown in figure 2.
Location
A video camera mounted on a stabilising board, was lowered into the water column while carefully monitoring the TV screen. This allowed the camera to be lowered to the optimum depth for viewing the seabed at best resolution. Two sites were chosen, a sandy area of bed and a rocky area, to contrast the two. Due to surveying within the special area of conservation no grabs were allowed to be taken preventing our survey from categorically determining the sediment types of the seabed. Once in the lab a habitat map was created for our specific location. By analysing the tow fish tracks boundary zones were calculated and the outside boundary lines were calculated in relation to distance from the tow fish itself.
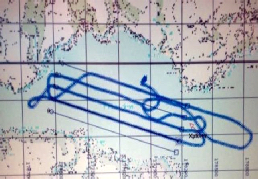
Figure 3: Transects of the sidescan sonar within the Helford River.
Figure 2: operations of the Sidescan sonar system.
Source: (http://oceanexplorer.noaa. gov/ gallery/technology/technology.html)
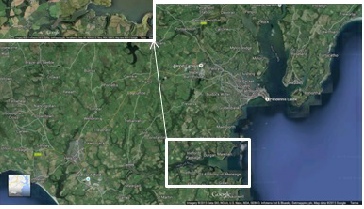
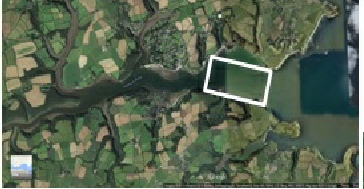

Figures 1a-d: Location of the 4 transects carried out in the Helford River and the path the vessel took along them.
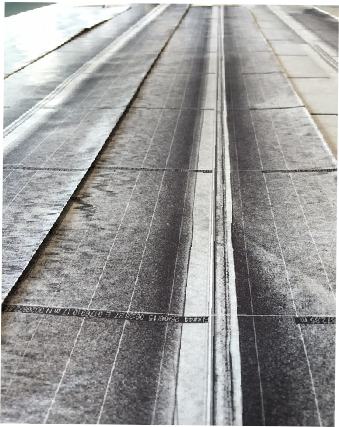
Figure 4: Image showing complete side scan trace obtained on site and used during the lab session.
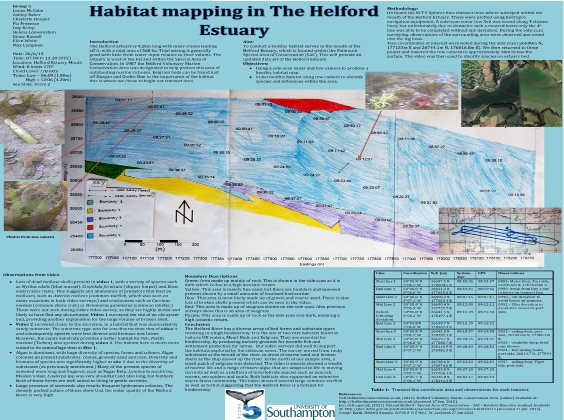
Discussion
The Helford River has a diverse array of bed forms and substrate types resulting in high biodiversity. It is the site of two rare UK habitats, Mearl Beds and Eelgrass. These are essential for biodiversity, by producing nursery grounds for juvenile fish and settlement protection for larvae. The video survey supports the habitats explored by the sidescan survey, giving a conformation of sediment types. The survey moved from rocky substrates at the mouth of the river, to areas of coarse sand and broken shells as the ship moved up the river. In the north of our sample area, a small patch of eelgrass was detected. The video transects showed a wealth of marine life and a range of macro algae that are adapted to life in moving currents, as well as a plethora of invertebrate species such as peacock worms, sea spiders and gastropods. Both habitats also supported an extensive macro fauna community. The video showed several large common starfish as well as turbot suggesting that the Helford River is a hotspot for biodiversity.
A
B
C
D