Disclaimer: The above statements and veiws are those expressed by the team members of group 5 and do not reflect those of the University of Southampton or the National Oceanography centre staff or other students
Offshore Chemistry
Essential Nutrients
Nitrate: is essential for Amino Acids, the building blocks of proteins. Metabolic growth is not possible without Nitrates. It also has an important role as a limiting element, as Liebig said: “yield is proportional to the amount of the most limiting nutrient,” meaning that in this case, phytoplankton can only grow as much as nitrate concentrations will allow.
Silicate: the outer shells, or frustules, of 2 main phytoplankton species Diatoms and Dinoflagellates consist of silicate. This means that is it removed from the water column by assimilation, or added through remineralisation.
Phosphate: is a fundamental biological element that forms DNA and ATP/ADP for energy release in phytoplankton and zooplankton with proportional amounts to lifestyle, survivors or opportunists.
Changes in nutrient concentrations in a frontal system
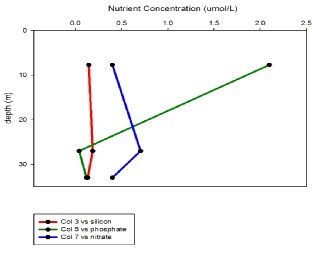
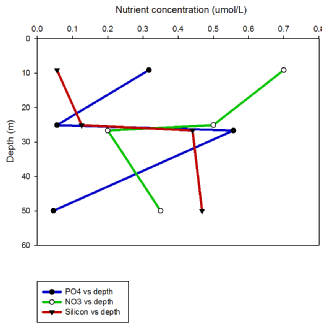
Station 5
We can see that as depth increases concentration decreases for phosphate. This is substantial between 7m at 2.10umol/l to a depth of 27m with a concentration of 0.04umol/L. From 27m the concentration starts on an increasing trend down to 33m. Nitrate starts at a small concentration of 0.4umol/L at 7m and gradually increases over the following 20m to a concentration of 0.7umol/L at 27m. After this depth the concentration begins to decrease again which is expected at the bottom of the photic zone due to the nitrate being assimilated. Silicon concentrations over the 33m sampled range vary very little. From the surface bottle sampled at 7m the silicon increased very marginally from 0.145umol/L to 0.187umol/L over the following 20m.
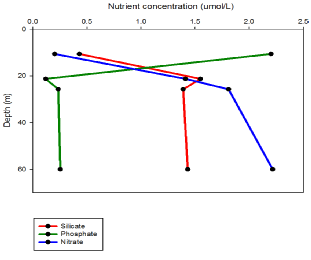
Station 6
Phosphate follows a similar trend between 10m and 25m to that seen at station 5. From 25m to 60m there is minimal change to concentrations. Nitrate concentration increases rapidly between 10 and 25m with an increase of 1.297umol/L seen. Down to 60m the concentration continues to increase but at a slower rate to a bottom concentration of 2.217umol/L. At the surface of this station, phosphate concentrations were higher that both nitrate and silicate. The trend of silicate differs from station 5. Between 21 and 25m the silicon concentration decreases slightly due to reaching the nutricline where the nutrients are either utilised or re-mineralised. The concentration increases from 0.429umol/L to 1.550umol/L over a depth of 11m. After 25m the concentration decreases linearly down to 60m with the bottom concentration being 1.432umol/L..
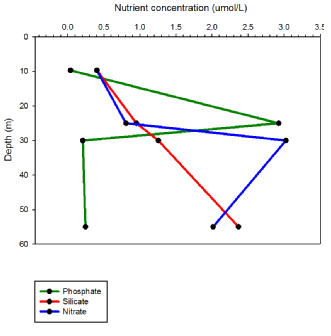
Station 7
Phosphate increases between 9.7m and 25m where it meets the nutricline. The maximum phosphate concentration is 2.925umol/L. The reason for this trend could be due to the position of the station. The distance from the coast results in phosphate being diluted, meaning we would expect surface levels at station 7 to be lower. From 25m the phosphate rapidly decreases due to the phytoplankton utilising the large concentration of phosphate. Over the following 5m the phosphate concentration was depleted to 0.208umol/L and from here the concentration changed very little down to 55m. Silicon over the 45m sampling range increases linearly from 0.405umol/L at 9.7m to 2.367umol/L at 55m. This could be because of the phytoplankton population in the area not siliceous and therefore not utilising the silicon. This results in a linear increase of silicon throughout the water column which is seen. Another reason for this would be the remineralisation of the silicon also resulting in the increase in silicon concentration. Nitrate concentration increases by 2.621umol/L between 9.7m to 30m, where it reaches the nutricline. From here the concentration decreases to 2.016 due to being utilised by the phytoplankton bloom at the nutricline.
Station 12
We see a distinct nutricline at ~25m which coincides with the chlorophyll maximum silicate concentrations increase between 9.7 and 25m as a bloom of dinoflagellate was present (images from plankton samples.) The bloom causes a saturation of the element in surface waters leading to remineralisation. There is a drastic increase between 25m and 30m as remineralisation intensifies at the chlorophyll maximum due to large populations of diatoms (back up with chlorophyll data.) It continues to increase to 55m, but only marginally, as populations are significantly smaller below the Cmax, as it is no longer part of the photic zone. Nitrate removal occurs between the two surface samples of 9.7 and 25m. Removal intensifies dramatically at the Cmax due to huge populations. This creates the nutricline at 25m, as nitrate is the limiting element. Below this, removal stops and concentrations increase by 0.1 umol l-1. The removal at the chlorophyll maximum was so intense, that no population can be sustained below it. (With this increase of nitrate, we should see a decrease in the chlorophyll data.) We also see nitrate is the most abundant element at the Station 12. The graph also shows phosphate removal at the surface, dramatic increase at 25m, then removal again at depth. The drastic increase at 25m coincides with the Cmax, due to large populations of phytoplankton. The huge increase of biomass shown by the chlorophyll data supports the idea that large biomass = large phosphate concentrations.

A
B
C
D
Figure 2 A-D: Nutrient concentrations of Nitrate, Phosphate and Silicon with depth for stations 5,6,7 & 12.
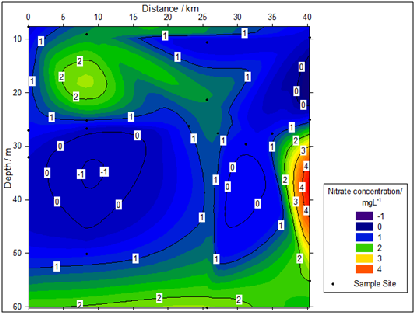
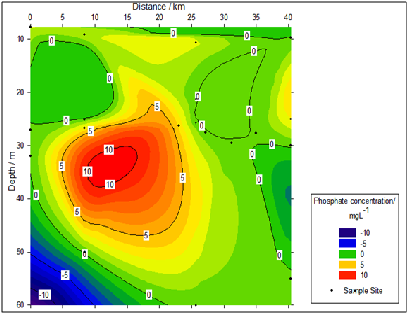
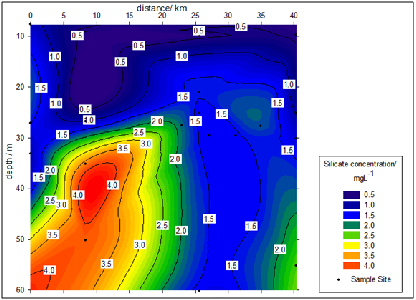
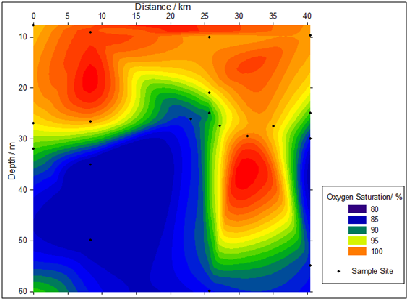
Figure 1: Contour graphs showing the change in Nitrate, Silicon, Phosphate and Dissolved oxygen with distance across the front relative to station 5, 0km.