|
Site Number |
Latitude |
Longitude |
Time (GMT) |
Depth (m) |
Secchi disk depth (m) |
Wind speed (knots) |
Average salinity |
|
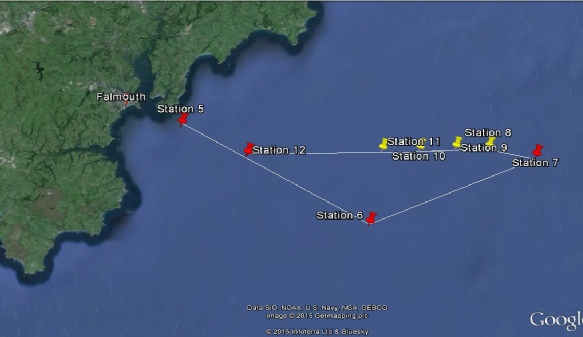
5 |
50 07.521N |
004 58.683W |
08:54 |
33.9 |
30.7 |
|
35.3 |
|
6 |
50 00.133N |
004 40.483W |
10:26 |
75 |
16.2 |
2 |
35.3 |
|
7 |
50 06.042N |
004 24.825W |
13:03 |
69.2 |
13.7 |
5.5 |
35.3 |
|
8 |
50 06.530N |
004 29.354W |
14:21 |
68 |
14.2 |
6.7 |
35.3 |
|
9 |
50 06.459N |
004 32.507W |
14:45 |
67.7 |
14 |
|
35.3 |
|
10 |
50 06.292N |
004 35.940W |
15:08 |
67.2 |
13.8 |
8.2 |
35.3 |
|
11 |
50 05.204N |
004 39.482W |
15:48 |
67.6 |
13.8 |
9.1 |
35.3 |
|
12 |
50 05.654N |
004 52.305W |
17:00 |
64.4 |
13.2 |
8.8 |
35.3 |