Disclaimer: The above statements and veiws are those expressed by the team members of group 5 and do not reflect those of the University of Southampton or the National Oceanography centre staff or other students
Offshore Physics

Temperature/Salinity Diagrams
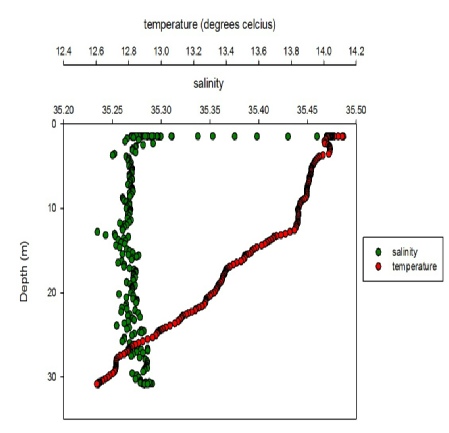
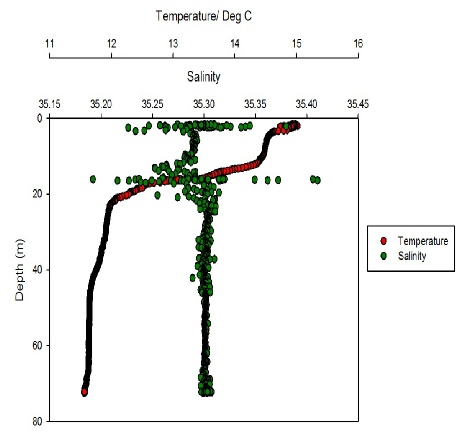
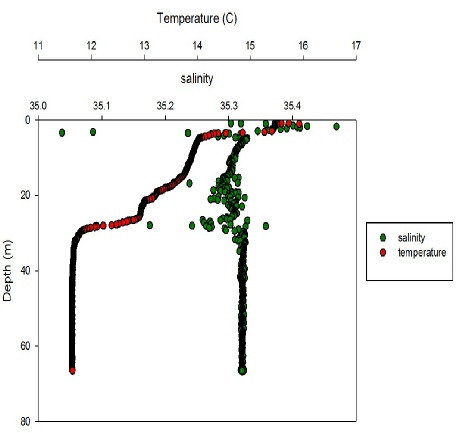
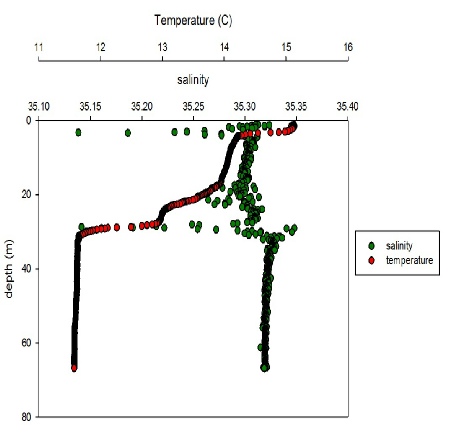
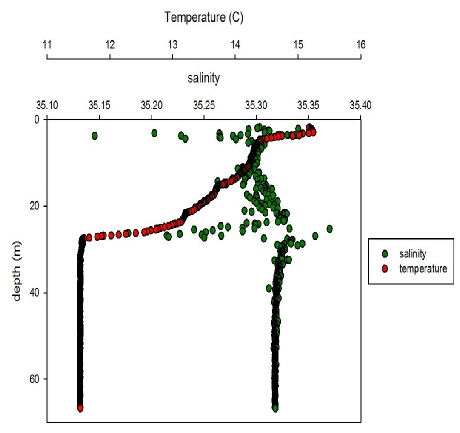
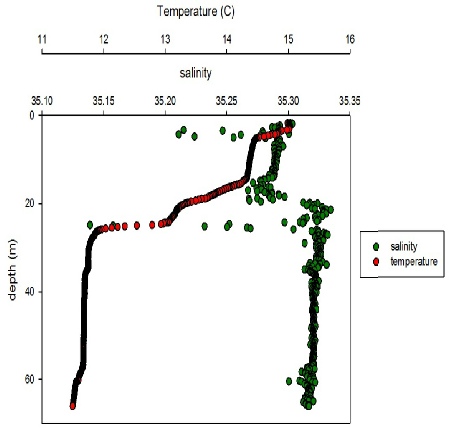
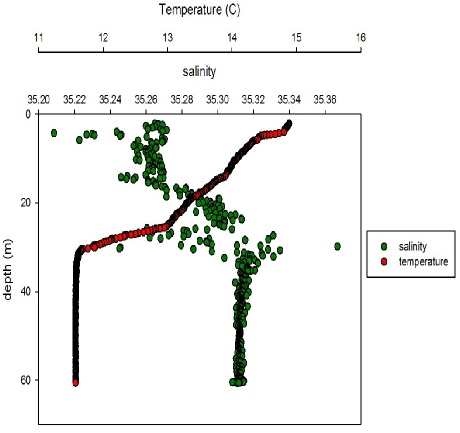
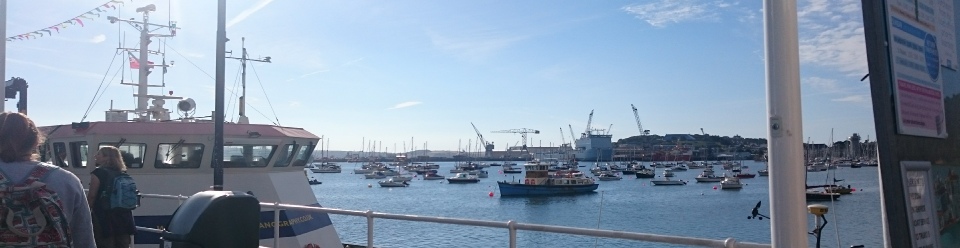
Figures 1.1 - 1.8: Temperature and Salinity profiles of the vertical water column in metres for sampled stations 5-12 in the waters offshore of Falmouth.
There is a similar pattern between stations 6 to 12 of thermal stratification. Surface layers are warmer and decrease in temperature as the depth increases. This trend was to be expected as the previous weeks had been warm and the surface waters would be warmer. Exceptions to this trend are station 12 which has a better mixed surface layer with the sudden change in temperature occurring lower down at depth of approximately 30m. Also station 5 does not appear to be stratified. The pattern shows a more linear decline in temperature from surface to depth due to significant mixing.
The salinity follows a pattern of a general increase as we moved offshore from station 5 to station 7. As we transected back inshore, the trend of increasing salinity continued. From station 9 to station 12 the salinity began to decrease again. Across all stations the salinity values change marginally of 0.5 so this is not a significant change. Each profile follows a linear pattern from the surface to depth except for Station 12 where the surface salinity is lower at the surface compared to at depth.
ADCP/Richardson’s number
In order to determine the state of the flow in the water column, the Richardson number can be applied. By calculating a Richardson number at a series of depth intervals down a stably stratified water column, the degree of flow laminarization and vertical mixing can be estimated. Furthermore by adding a temperature plot to the same profile an analysis of the effects of mixing by the thermocline can be obtained
The dimensionless Richardson number is defined as Ri=N2/(du/dz)2, where N2, the Brunt-Vaisala frequency, is defined as N=√-g/ɵ.dɵ/dz. By using two critical values, the Richardson number can define a flow as turbulent or laminar. If the Richardson number is greater than 1 then the flow is described as turbulent and if the value is less than 0.25 then the flow is described as laminar (Galperin, Sukoriansky and Anderson, 2007).
To calculate the Richardson numbers the horizontal flow velocity was measured at 1 m depth intervals by the ADCP to calculate the shear and density, used to calculate stratification, was measured in-situ by the CTD. The figures represent dominant turbulent flows throughout the water column as a result of the tidal-dominated flows of Falmouth Bay and the Western English Channel. The red lines on each figure represent the constants defining laminar and turbulent flows. Laminar flows are occasionally observed on or below the thermocline, suggesting its presence is preventing vertical mixing over the entire water column. The strong stratification also indicates the presence of internal waves. Turbulence in the thermocline could be attributed to the propagation and breaking of these internal waves.
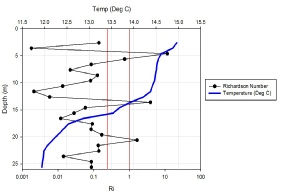
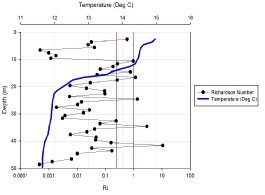
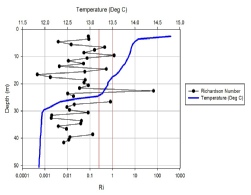
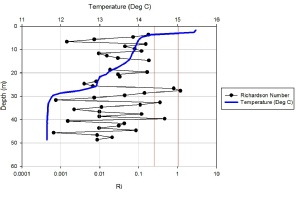
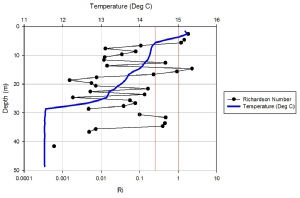
Figures 2.1-2.5: Richardsons number change with depth (m) for stations 5-10. Stations 11 and 12 are absent due to a fault in the ADCP.