Introduction
Sampling began at the King Harry Pontoon (location 50°13.930N 005°41.1636W) at 12:30
GMT on the 24th June 2014, two hours after low tide. When on the pontoon three stations
were set up; one using a current metre, another taking water samples and another
using a YSI multiprobe. Samples were taken every half hour until 15:00 GMT, with
the current-
Methods
The current-
The water samples taken were filtered in-
The YSI probe was lowered through the water column and provided measurements of temperature, salinity, depth, pH, turbidity, chlorophyll concentration, dissolved oxygen and voltage. It should be noted that due to a calibration error the turbidity readings provided by the YSI probe were incorrect and have therefore been omitted from our data set.
Results
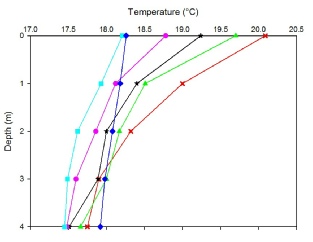
Analysis of the temperature data (Fig.1) produced from the YSI multiprobe data showed that the temperature decreased with depth at all times sampled. It can also be seen that as time went on and solar radiation reduced, the temperature also decreased. The exception to this pattern is the readings taken at 15:00 GMT, where the surface temperature is much higher than at 14:30 GMT, and the bottom temperature is the highest reading taken at this depth (17.92°C). The cause of this may be either a fault in the instrumentation or perhaps from the arrival or departure of a ferry disturbing the sediment and mixing the water column, distorting the results. Another possible reason for the decrease in temperature with time is the arrival of colder saline water as the tidal cycle moved towards high tide.
GMT

Fig.1: Temperature time series against depth at King Harry Pontoon
Salinity
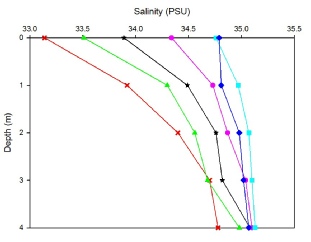
As the area sampled is an estuary, the salinity changes with both time and depth. When looking at how the salinity changes with depth, it can be seen from Fig.2 that at the start of the survey there was a significant increase in salinity with depth due to an overlying layer of less dense freshwater¹³. However, as time progressed, the change in salinity became less pronounced and the water column was more uniform. Again, the exception to this pattern is the sample taken at 15:00 GMT, which has an unusually high salinity at the surface, followed by a significant drop at one metre depth. It is likely that this anomaly was caused by the presence of a ferry mixing the water column. A look at salinity over the entire tidal cycle shows a significant increase in salinity, corresponding with the surveys position in the tidal cycle, as salt water is moving up the estuary, pushing the river water back and forming a salt wedge¹³.
GMT
Fig.2: Salinity time series against depth at King Harry Pontoon
Chlorophyll
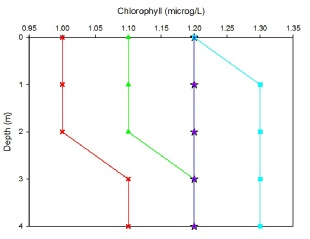
The chlorophyll readings taken (Fig.3) show an irregular pattern with both time and
depth. However when averaged over the time of sampling, the amount of chlorophyll
in the water column increased and also became more constant with depth. It is likely
that this is once more related to the increased amount of sea water entering the
estuary, bringing photosynthetic organisms with it. The organisms themselves may
have adapted to the tidal cycle as a way of increasing the amount of light and nutrients
they receive¹⁴. Nutrient run off, both natural and man-
Fig.3: Chlorophyll time series against depth at King Harry Pontoon
GMT
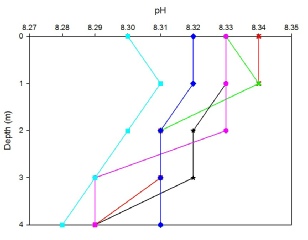
pH
The pH on average (Fig.4) shows a decrease over time. However, the readings are very sporadic, and do not seem to show a pattern over depth. The readings at the bottom of the estuary tend to be lower than the ones at the surface, which is unusual considering that seawater is more alkaline then freshwater¹⁷. It is also denser than is normally found at the bottom of the water column¹³. It is also not expected that the pH would decrease over the tidal cycle, as the water is becoming more saline and should, in theory, become more acidic. As the turbidity equipment was faulty, it is possible that the measurements taken for pH were also done using incorrect equipment.
Fig.4: pH time series against depth at King Harry Pontoon
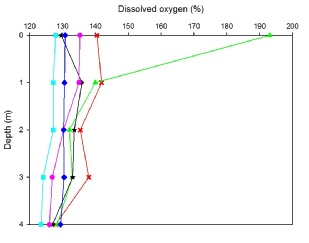
Fig.5: Dissolved oxygen time series against depth at King Harry Pontoon
Disclaimer: The views expressed above are the opinion of the authors only and NOT that of University of Southampton or National Oceanography Centre, Southampton.

GMT
GMT
Dissolved Oxygen
Measuring dissolved oxygen content in the water is another good way of assessing the productivity of the area, and can also be used to look at how much organic pollution is in the system¹⁸. This is because an increase in phytoplankton in the area will result in an increase in photosynthesis, a process which produces oxygen. High dissolved oxygen readings would therefore indicate the presence of a large amount of photosynthesis. Organic enrichment in the estuary would result in very low dissolved oxygen readings, as the increase in nutrients encourages blooms of plankton which, when they die and decompose, use up all the available oxygen, resulting in hypoxia¹⁵. The readings (Fig.5) taken in this investigation are all above 100%, which indicates that there is a net input of oxygen to the area, most likely through photosynthesis¹⁸. This also means that there is unlikely to be any problems with organic pollution in this region of the river. The percentage remains mostly constant with depth, which may suggest that the estuary is suitable for photosynthesis throughout the water column. Over time, the amount of dissolved oxygen does decrease, with the highest surface reading, 140.5%, recorded at 13.30 BST, at the start of the sampling and the lowest surface reading, 127.9%, at 15.30 BST. The readings at 16.00 again show a strange pattern, with the surface readings higher than expected based on the previous samples, 130.8%. Once again this can most likely be attributed to the arrival or departure of a ferry causing additional mixing and disturbance in the water column. There is one more anomalous reading in this dataset; the surface reading at 14.00 when looking at dissolved oxygen in both a percentage and in mg/L falls far outside the expected range at 193.1% and 3.73mg/L respectively, and is therefore very likely to be a fault with the instrumentation as opposed to a natural value.
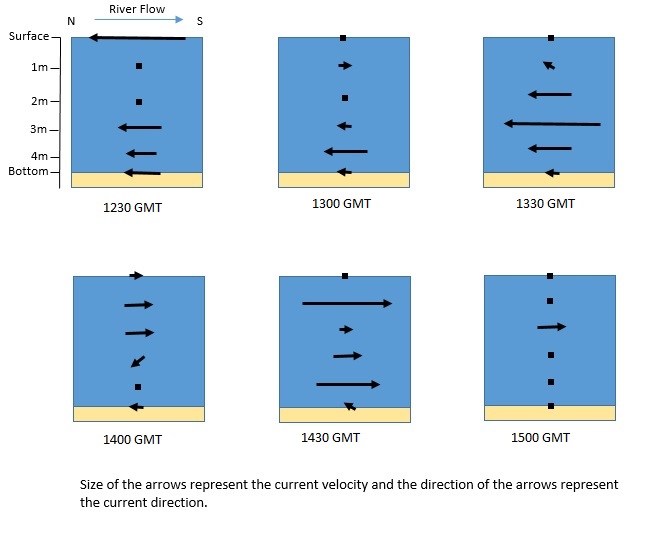
The current speed and direction was recorded on the 24/06/2014 from 1200 to 1500 GMT. Low tide occurred at 1022 BST and high tide at 1613 BST.
Time 1230 GMT– A weak Northward flow was observed, however a very strong Northward flow at the surface. This was caused by saline water intruding up the river during the flood tide.
Time 1300 GMT– The flow upstream appears to weaken in the top 3 meters. At 1 meter the current reverses completely creating a small southward current, freshwater flow down the river creates this. From 3m to 4.5m there is still a Northward flow upstream, this is caused by the flood tide. These results suggest The Fal is a salt wedge estuary as less dense fresher water flows over more dense saline water pushed up the estuary with the tide. The overall slackening of the current observed at this time may be caused by a young flood stand type event.
Time 1330 GMT– There is a strong northward current, with flow speed reaching 3.29
m/s at 3 meters depth. The young-
Time 1400 GMT– Again there is a weakening in the tidal current. The freshwater flow downstream dominates the current in the upper 2 meters. There is a very weak northwards flow in the bottom 2.5 meters caused by the flood tide however the current velocity is much less than previous times because it is coming to the end of the flood tide.
Time 1430 GMT– There is a strong southward flow downstream, with flow velocity reaching a maximum of 0.464 m/s at 1 meters depth. These results were unexpected. High tide was predicted for 16:13 therefore at 15:30 the flood tide should still be taking place and so a northward flow would have been expected. A possible explanation for these unexpected results is that at the time of measurement a small ribbed boat left from the pontoon only a couple of meters from where we were recording therefore this may have disturbed the current in the area we were measuring.
Time 1500 GMT– The current was extremely weak during this time, with all but one depth giving readings of 0 m/s. This may be because the measurement was taken only 13 minutes before high tide therefore slack water is approaching and the current velocity decreases rapidly before the ebb tide begins.