For part of the field course at Falmouth, a practical session offshore was undertaken in order to find out how the chemistry, physics and biology changed as one moved further offshore. In this, seven stations were sampled in order to look at changes in the water physics, which ultimately affected the chemistry within the water column, hence deciding how the ecosystem within the water column operated.
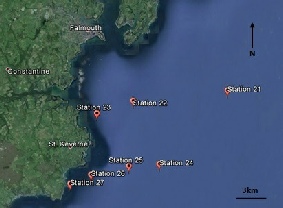
Sampling Stations
Methods
ADCP
An ADCP (Acoustic Doppler Current Profiler) is mounted on the bottom of the research vessel Callista. It sends out acoustic pulses into the water column to measure the current direction and speed using the Doppler effect. It also determines the backscatter of the water column. At each station an ADCP file was created to determine areas of backscatter which potentially indicates a large zooplankton community.
CTD
At each station the CTD was deployed 5m above the sea bed to ensure that it did not interact with the sea floor, potentially causing erroneous readings. Temperature, salinity, fluorescence and chlorophyll measurements were calculated on the descent of the CTD which were displayed on a computer. These images determined where water samples were to be taken (e.g. at the depth of an interesting feature) and the CTD was stopped during its ascent for a series of Niskin bottles to be remotely fired at various depths in order to collect a water sample. Once the CTD reached the surface it was recovered and the water samples were retrieved.
Station 21 Latitude 50°05.635N Time 0842 GMT
Longitude 004°52.513W Weather 8/8 octants Depth 64.5m Wind speed 12 knots
Station 22 Latitude 50°05.046N Time 1030 GMT
Longitude 005°00.218W Weather 7/8 octants Depth 53m
Station 23 Latitude 50°04.372N Time 1120 GMT
Longitude 005°003.172W Weather 7/8 octants Depth 29m
Station 24 Latitude 50°01.725N Time 1200 GMT
Longitude 004°58.027W Weather 5/8 octants Depth 66m
Station 25 Latitude 50°01.606N Time 1250 GMT
Longitude 005°00.516W Weather 2/8 octants Depth 67m
Station 26 Latitude 50°01.128N Time 1320 GMT
Longitude 005°03.599W Weather 6/8 octants Depth 50.53m
Station 27 Latitude 50°00.637N Time 1422 GMT
Longitude 005°05.291W Weather 2/8 octants Depth 26-

Disclaimer: The views expressed above are the opinion of the authors only and NOT that of University of Southampton or National Oceanography Centre, Southampton.

Oxygen Sampling
A hose was attached to the tap of the Niskin bottle and placed into a glass bottle. The tap was opened and the hose was squeezed to ensured there were no air bubbles in the sample. Once the sample was filled, 2 reagents were added to the sample in order to preserve it. 1ml of manganous chloride and 1ml of alkaline iodide were added using a pipette. A stopper was then added and the sample was inverted and placed in a bucket full of water to ensure no air entered the bottle. The oxygen samples were collected from the Niskin bottles prior to the other nutrient samples to ensure an accurate oxygen value.
Phytoplankton, Chlorophyll, Si, NO3 and PO4 Sampling
A large plastic container was ¼ filled and rinsed using the Niskin bottle sample prior to being completely filled. For the phytoplankton sample, 100ml was measured and placed into glass bottles containing iodide. 50ml of the sample was filtered and the product was collected in a plastic bottle for silicate analysis. Another 50ml was filtered and the product was collected in a glass bottle and chilled for phosphate and nitrate analysis. Finally, 50ml of the sample was filtered and the filter paper placed in an acetone tube and chilled. This was for chlorophyll analysis and the filters from the previous two 50ml filtrations were also used for analysis.
Zooplankton Sampling
The plankton net is a large conical net with a weighted collection bottle at the base. The deployment of the net involves it being lowered to determined depths in the water column and pulled up through the water column collecting plankton. The top of the net can be pulled shut with a messenger in order to prevent plankton above the target depths being collected. The water samples collected are made up to at least 1L and stored in plastic bottles. The total volume of seawater sampled can be calculated using the follow formula:
r2 L = V
r = Radius of net (m), 0.62
L = Towing distance (m)
V = Volume of seawater sampled (m3)
Net samples were taken at:
Station 21 35-
Station 22 45-
Station 23 5-
Station 24 30-
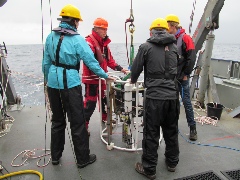
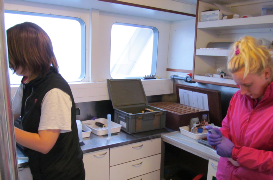
Image 1: Deployment of the CTD on RV Callista
Image 2: Collection and filtration of Niskin water samples in RV Callista’s wet lab