

Phytoplankton and Zooplankton
The diversity of species and number of individuals caught in the plankton net was significantly less then when compared to the same data samples offshore. Zooplankton are primarily marine organisms, and as the samples were taken in increasingly freshwater, their abundance decreased. Only very euryhaline organisms are able to reach the lowest salinities in the estuary, and this absence of grazing is one reason why there are such high phytoplankton values and such a shallow euphotic zone in the upper reaches of the estuary. However, one other reason for the lack of zooplankton in these samples may be due to the sampling method. Rather than taking a sample from an area observed from the CTD to have a high level of chlorophyll, or a high amount of backscatter on the ADCP, the plankton net was towed along the surface for five minutes. As a consequence, the main patches of zooplankton may have been missed in the samples, particularly at the first stations in deeper water where there may be a Deep Chlorophyll Maximum (DCM).
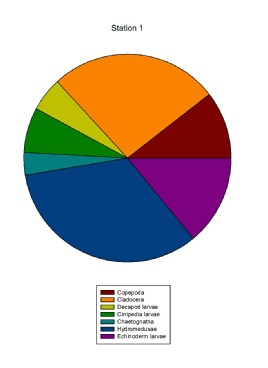
Station 1 (Fig.2)
Station 1 was the closest to the sea, and so had the highest numbers and diversity of zooplankton. Cladocera, which was the most abundant in many of the samples taken offshore, was observed marginally less in the samples taken at this station. Instead, the most abundant class was Hydromedusae (33.3%). This may be less due to the levels of phytoplankton in the water, and more due to the currents. It is possible a high number of Hydromedusae became trapped in the mouth of the estuary due to the convergence of the waves heading upstream, and the tide, which was just beginning to ebb out of the estuary. In terms of phytoplankton, this station had the lowest numbers of diatoms, but relatively high numbers of dinoflagellates. This is due to the high numbers of grazing zooplankton at this station, relative to the others. Also, the river is a source of nutrients and at the lower end of the river many of them have been depleted, limiting growth and productivity at the mouth of the estuary.
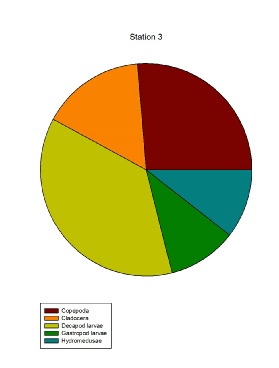
Station 3 (Fig.3)
The number and diversity of zooplankton is notably less then seen at Station 1, which corresponds to the decreasing salinity of the environment. The most dominant organisms in this sample are Decapod larvae and copepods, with abundances of 37% and 26% respectively. This indicates they have a larger salinity range then the other dominant species seen in plankton trawls from offshore, such as Appendicularia. Hydromedusae, despite normally being one of the most abundant organisms in the nets, were present in the lowest numbers at this station, making up only 10.5% of the sample. This could again be related to the tidal state, as it was flowing out to sea at this time and so any individuals would be heading towards the ocean. In terms of phytoplankton, 90% of this sample was comprised of diatoms, with only 10% being made up of dinoflagellates. This corresponds to the water column at this station, as it is still far enough towards the mouth of the estuary that the water column is well mixed and homogenous.
Station 6 (Fig.4)
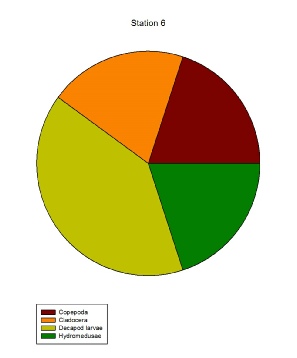
Station 6 was taken at the lowest salinity, and this corresponded with both the highest levels of phytoplankton and the lowest numbers of zooplankton. Only four different types were identified, and at very low numbers. Decapod larvae were only marginally more dominant then the other species, making up 40% of the sample, potentially due to their more euryhaline nature. However, in terms of numbers, there were two Decapod larvae found at this station, and only one individual from the other three groups, so overall it is likely that there is still a low abundance of these organisms this far up the estuary. A phytoplankton sample was not taken at this station.
Fig.1: Percentage abundance of diatoms and dinoflagellates in Fal estuary at stations 1 to 7.
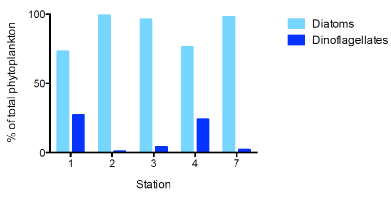
Fig.2: Zooplankton abundance and diversity at Station 1
Fig.3: Zooplankton abundance and diversity at Station 3
Fig.4: Zooplankton abundance and diversity at Station 6
Disclaimer: The views expressed above are the opinion of the authors only and NOT that of University of Southampton or National Oceanography Centre, Southampton.
