


After deploying the CTD to maximum depth at each station as a group we identified areas of interest from the temperature, salinity and fluorescence data. At the chosen depths Niskin bottles attached to the CTD rosette were remotely deployed to collect water samples. These were then analysed in the laboratory for their phytoplankton and zooplankton content as well as oxygen, chlorophyll, silicate, nitrate and phosphate concentrations. At this time of year in a seasonally stratified water column, such as those displayed at the majority of our stations, we would expect there to be a depletion of nutrients in the surface waters due to the earlier spring bloom25. Because of this lack of nutrients it is probable that the majority of phytoplankton would be concentrated on or near the thermocline, where they will be able to utilise any nutrients that up well into the surface waters27. This depth would show the point of high photosynthesis we would therefore expect to see the maximum oxygen saturation in the same area. In well mixed water columns such as Station 23 it is likely that nutrient concentration would be near to homogenous, and phytoplankton limited by the depth of the euphotic zone.
Chlorophyll
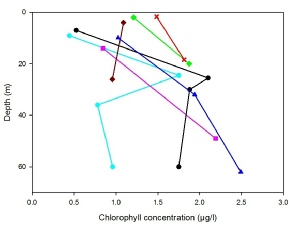
Our chlorophyll concentration measurements (Fig.1) display a similar profile to that produced by the CTD fluorometer, with concentrations lower in the surface waters, increasing to a maximum. n the cases of stations 21 and 24, there is a further reduction below the thermocline. Due to the homogenous nature of the water column at station 23 there is a surface maximum of chlorophyll as there is plenty of sunlight and nutrients being mixed to the surface, making this the prime position for photosynthesis. Stations 22 and 25 exhibit unexpected profiles for stratified waters as both have their chlorophyll maximum at the deepest point. This is unusual as the euphotic zone depths for these stations (estimated from secchi disk depth) is 24m and 21m respectively, meaning photosynthesis is unable to occur so there is no reason for active phytoplankton to be that deep. This increase in chlorophyll with depth may be due to a large flux of photodetritus from the spring bloom27, which would still be read as chlorophyll but is not picked up by the fluorometer as it is not actively photosynthesising.
Fig.1: Chlorophyll concentration against depth for stations 21-
NO3
The expected pattern of surface nutrient depletion24 is exhibited by all but one
of our stations (Fig.2). Station 26, which from the two samples that were made, shows
a surface maximum in nitrate. However, seeing as the water column depth at Station
26 was 50m this may not be a reliable sample, on reflection it would have been beneficial
to have taken a bottle sample below the thermocline at this station. Station 23 shows
a slight increase in NO3 concentration with depth, as is expected from the surface
chlorophyll maximum shown above. Station 24 and 21 once again display the anticipated
profile, with NO3 minimums at or just below the thermoclines. Stations 22 and 24
do not show a NO3 minimum, this may be due to the absence of chlorophyll maximums
but is more likely due to the lack of samples for these stations having missed the
changes in concentrations.
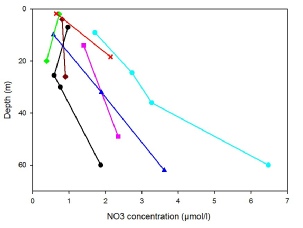
Fig.2: Nitrate concentration against depth for stations 21-
Oxygen % Saturation
There is supersaturation of oxygen at all stations in our survey, meaning that there is some form of input such as primary production or mixing throughout the water column. There appears a strong correlation between oxygen saturation and chlorophyll at Station 24 with both showing maximums at around 25m. Station 21 does show a relationship between chlorophyll and oxygen as there is a maximum at 25m followed by a minimum at around 40m, but the maximum of chlorophyll is more pronounced than for oxygen and vice versa for the minimum. The deep oxygen maximum shown at Station 21 may be due to the low temperature relative to the other stations. There is a strong reduction in oxygen saturation at Station 23 which is likely to be a result of its shallow euphotic zone (6.9m). According to Fig.3, Station 27 appears to only increase in oxygen saturation down to depth 20m, this may be due to the euphotic depth being only 6m and the thermocline being very shallow, meaning that the oxygen maximum may be sitting between the two sample positions.
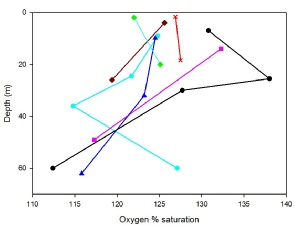
Fig.3: Percentage oxygen concentration against depth for stations 21-
Silicon
Silicate is a nutrient primarily utilised by diatoms in the building of their frustules (outer shells)28. It is therefore likely that silicate minima correlate to the highest concentration of diatoms and other phytoplankton. Referring to Fig.4, Station 26 appears to have extremely low levels of silicate even though it by no means has the highest amount of diatoms in the water column (see phytoplankton graph). Looking at the data collected from this station there does not appear to be a conclusive reason for this depletion of silicate, although due to only two samples being collected it is uncertain what the silicate concentrations are deeper in the water column. Silicon is not only removed from saltwater by diatoms but also through settling into the sediment and reactions of dissolved silicate with clay minerals26. This may explain the continuing removal of silicate below the thermocline at Stations 21, 22 and 25. Station 24 shows the most idealised silicate profile as the minimum sits at the depth of the highest chlorophyll, followed by a large increase in concentration below the thermocline due to the lack of photosynthetic organism removal.
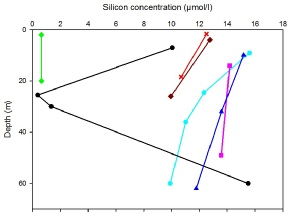
Fig.4: Silicon concentration against depth for stations 21-
PO4
Phosphate is removed from seawater primarily through deposition and burial in the sediment as well as through biological uptake29. In theory it is expected that PO4 would follow the same profiles displayed by NO3 and other macronutrients, however, this is not the case for our stations (Fig.5). Stations 21 and 24 show profiles that have a minimum of PO4 in the surface waters followed by a maximum just below the thermocline and a gradual removal into the sediment with depth. Both Stations 22 and 25 show an overall increase of PO4 over the entire water column but do not appear to show a removal of phosphate in deeper water. Station 26 shows a reduction in PO4 concentrations above the thermocline as expected, however beyond this the concentrations are uncertain due to a lack of samples. Once again, due to the shallow water column at Station 27, there is an overall increase in nutrients, probably due to the shallowness of the euphotic zone and therefore the lower amount of photosynthesis occurring, which allows nutrient concentrations to build up. Station 23 has the highest PO4 concentration at the surface, this is likely to be due to the close proximity to the land and estuary, which is a major input of PO4 to the seawater29.
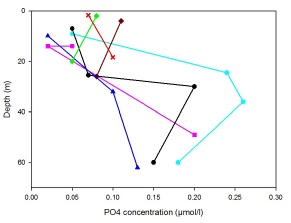
Fig.5: Phosphate concentration against depth for stations 21-
Disclaimer: The views expressed above are the opinion of the authors only and NOT that of University of Southampton or National Oceanography Centre, Southampton.
