


Temperature vs Depth
The waters off the coast of Falmouth are seasonally stratified (Fig.1). This means that the waters are well mixed in the winter due to increased wind stress causing turbulent mixing throughout the water column. During the summer, wind stress decreases and, as the amount of incoming solar radiation increases, a warmer surface mixed layer and thermocline is produced. In this investigation, seasonal stratification can clearly be seen at all stations excluding station 23 (Fig.2).
The stations closer to the shore show a shallower thermocline (5m-
A possible explanation for the lack of seasonal stratification at station 23 is that the water depth here is only 29m, making it one of the shallowest stations sampled. Friction between the sea bed and the flow of the current creates turbulent mixing. In shallow water the energy of this turbulence is sufficient enough to mix the warm surface layer with the cold deeper water hence creating the homogeneous water seen at station 23.
There is also a frontal system offshore Falmouth. This creates warmer surface waters further offshore and cooler waters inshore. Stronger stratification offshore is responsible for the warmer surface waters observed at stations 21, 22, 24, and 25. Further inshore depth decreases, leading to increased mixing throughout the water column and causing the thermocline to be pushed up and destroyed completely. This process eventually creates a water column where cold deep water is mixed with the warm surface water. Hence creating a water column with less extreme surface and bottom values. Our data supported this as inshore stations 26 and 27 have cooler surface waters and warmer bottom waters than the stratified offshore waters.
Again station 23 is an exception. It is an inshore station, yet has warmer than expected surface waters. A possible explanation for this is that station 23 is located approximately 2.5 km from the mouth of the Helford River. The Helford River is a relatively small river, which therefore may have been heated significantly by the recent warm weather. This warm river water then flows into the sea creating a region of freshwater influence. Station 23 may be located in this warm region of freshwater influence.
Salinity vs Pressure
Stations further offshore had higher salinities on the whole (i.e. stations 21 and
24). Station 23 is approximately 2.5km from the Helford River. Freshwater input from
the river creates a surface layer of lower salinity, which can be seen in Fig.3.
Below this fresher layer, the salinity remains relatively constant with depth indicating
it is a well-
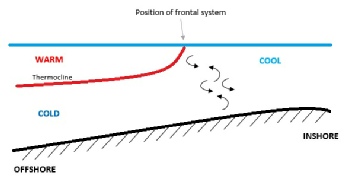
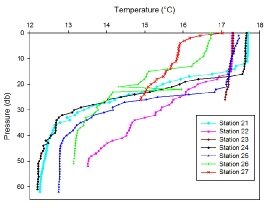
Fig.1: Mixing diagram showing frontal system and thermocline in Fal Estuary
Fig.2: Temperature against depth profile at Stations 21-
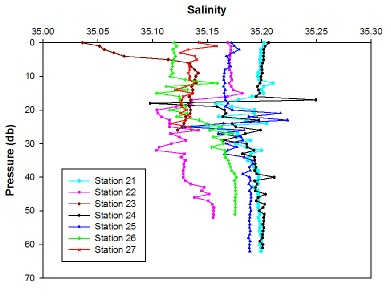
Fig.3: Salinity against pressure profile at Stations 21-
Richardson Number (Fig.4-
The Richardson number describes the behaviour of the current in the water column; whether the flow is laminar or turbulent.
Analysing the Richardson number allows us to determine whether the thermocline is preventing mixing or not – This is important as it directly effects nutrient and light availability to phytoplankton32. In order to calculate the Richardson number equation (1) was used. A Richardson Number below 0.25 means the water column is well mixed – Density stratification is weak and/or the shear of the current is high, resulting in laminar flow. A Richardson Number above 1 means the water column is stratified – Density stratification is strong and/or the shear of the current is small, resulting in turbulent flow.
All stations show roughly the same pattern, the majority of Richardson numbers calculated in the upper mixed layer are small (0.25 or less). This suggests there is a lot of mixing here, this is supported by the temperature profile plotted alongside the Richardson number – Where the Richardson number is smaller the temperature profile shows a more vertical line suggesting the upper mixed layer is isothermal and so is well mixed.
Below the surface layer at approximately 10 – 20 meters the Richardson Number increases to above 1. This suggests here that the water column is statically stable; there is little mixing because the energy required to overcome the density stratification is too great. The rapid increase in the Richardson number coincides with the location of the thermocline, therefore showing that the thermocline is acting as a strong barrier to mixing and the upwelling of nutrients. Below the thermocline the majority of the Richardson numbers decrease to 0.25 or less, suggesting that below the thermocline the water is well mixed.
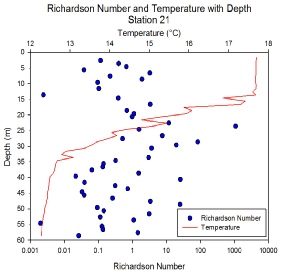
Fig.4: Richardson number for Station 21
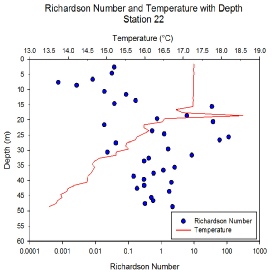
Fig.5: Richardson number for Station 22
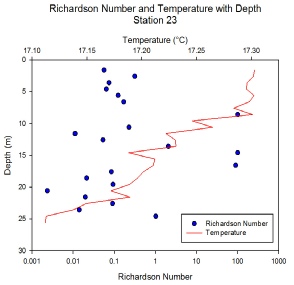
Fig.6: Richardson number for Station 23
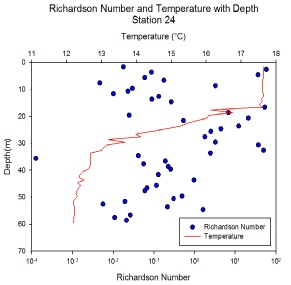
Fig.7: Richardson number for Station 24
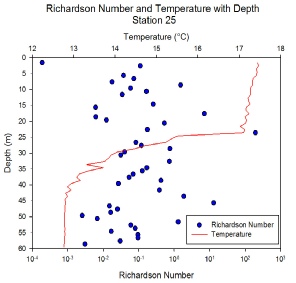
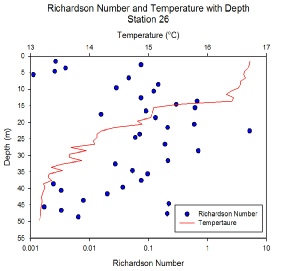
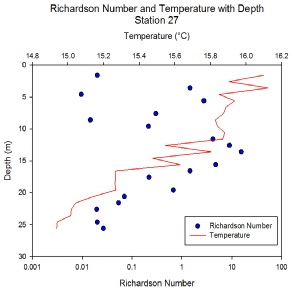
Fig.9: Richardson number for Station 26
Fig.8: Richardson number for Station 25
Fig.10: Richardson number for Station 27
Disclaimer: The views expressed above are the opinion of the authors only and NOT that of University of Southampton or National Oceanography Centre, Southampton.
