

Temperature vs Depth
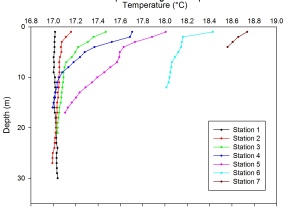
The temperature depth profiles from our seven stations indicate that, as the boat moved inshore, the water column became stratified, before again becoming homogenous. Station 1 for example, was positioned in the mouth of the estuary, where there was a strong flow and mixing, resulting in a water column of near constant temperature, despite its vicinity to the Penryn River. In comparison, station 4 shows a 0.7°C variance in between the surface waters and deeper waters. This is likely to be as a result of reduced flow and mixing, as well as the increased influence of freshwater from the rivers Fal, Truro and Carnon, which, due to its lower salt content, is less dense than the seawater and will thus sit above it, causing a barrier that allows the surface waters to warm far more than the waters below it. As the stations move further inshore the effect of the saltwater became less, hence reducing the level of stratification, as shown at station 6 which only has a difference of 0.2°C between the surface and bottom water. Station 7 again showed a less distinct change of temperature through the water column, which as well as being caused by more freshwater, may also be as a result of the lower depth, due to the flow of water over the seabed causing friction. Hence, this may be experiencing more mixing than that found in the deeper stations. Lastly, sampling of the upriver stations took place closer to midday, where the solar input is higher. This will have more of an impact on shallower water, resulting in significantly warmer water at the top of the estuary.
Fig.1: Mixing diagram showing salt wedge in Fal Estuary
Fig.2: Temperature against depth profile at Stations 1-
Salinity vs Pressure
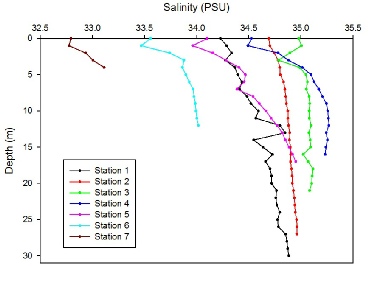
Salinity changes as you move along the length of the estuary due to the declining influence of the sea, and the increasing influence from the river. It is expected that the salinity measurements would decrease as you move towards the source of the river, and on average, the measurements taken followed this pattern. Station 7, the station furthest up the river had a salinity of 32.75 when compared to a salinity of 34.25 at Station 1, located at the mouth of the estuary. However, Stations 2, 3 and 4 have a higher salinity then Station 1, despite being located further away from the saline influence of the sea. It is possible that Station 1 has a slight freshwater influence due to its proximity to a river channel that leads into the estuary. Stations 2, 3 and 4 are more central in the estuary, further away from any riverine inputs.
Salinity also changes with depth as the sampling stations moved upriver. At Station 1, there is a change to more saline water as depth increases. The stations closer to the sea are more homogenous, as there is little influence from the river. However, the stations further up the estuary show a halocline as the more dense salt water is forced under the fresh water from the river, a feature characteristic of a salt wedge estuary. This can be seen most prominently at Stations 7, 6 and 5, where there is a sharp decrease in salinity to approximately 1m below the surface, after which the salinity starts to increase with depth. Station 2 shows the most homogenous salinity profile, as it was located in the centre of the estuary and therefore had no freshwater influences acting on it.
Fig.3: Salinity against pressure profile at Stations 1-
Richardson Number (Fig.4-
The Richardson number gives an idea of the potential for turbulence in the water column. Analysing the Richardson number allows us to determine whether the thermocline is preventing mixing or not – This is important as it directly effects nutrient and light availability to phytoplankton32. In order to calculate the Richardson number equation (1) was used. A Richardson Number below 0.25 means the water column is well mixed – Density stratification is weak and/or the shear of the current is high. A Richardson Number above 1 means the water column is stratified – Density stratification is strong and/or the shear of the current is small.
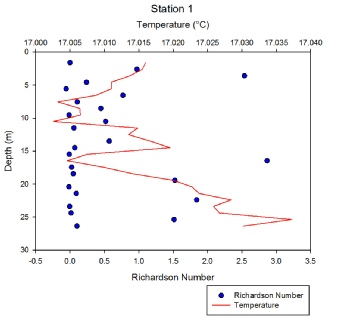
Station 1
The temperature profile at station one varies greatly with depth. Where the thermocline is present, a higher Richardson number exists implying that the water column is stable. When the temperature profile appears to be homogeneous, the Richardson number decreases to ~0. This indicates that the water column is well mixed. There are two more peaks in temperature and both coincide with a high Richardson number.
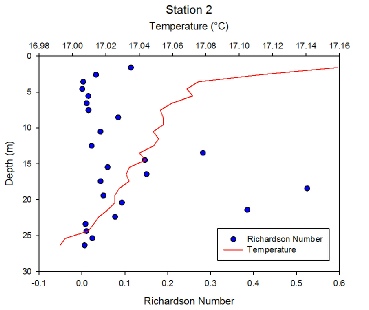
Station 2
The water column changes from 17.16°C to 16.99°C in ~25m. This is only a 0.61°C change
within the whole water column, representing a well-
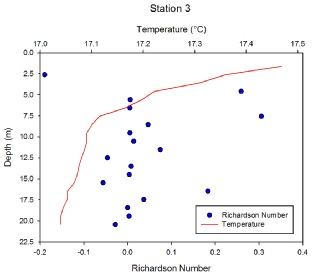
Station 3
The sharp change in temperature near the surface is accompanied by a larger Richardson
number. This implies that the water column has a stable density with less dense water
above more dense water. The rest of the water column varies 0.2°C and the Richardson
number coincides with this representing a well-
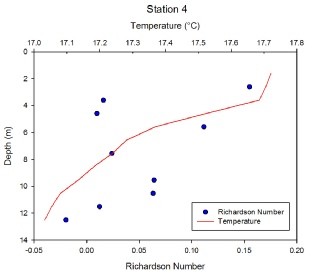
Station 4
Overall the Richardson number at this station is low, it remains below 0.25 for all depths. This suggests the water column is well mixed which is supported by the very small change in temperature observed. The temperature decreases by less than 0.7ᵒC from surface to the bottom.
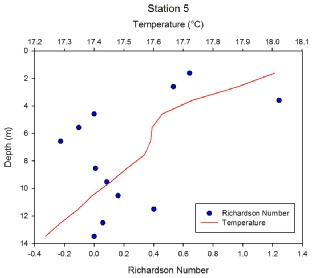
Station 5
The Richardson number is highest from approximately 1-
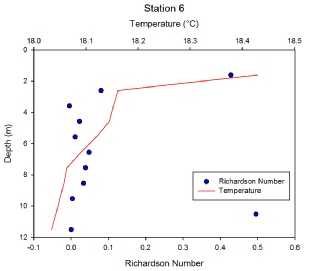
Station 6
There is a small thermocline present in the upper 3 meters of the water column. This rapid change in temperature creates density stratification therefore giving rise to a higher Richardson number. However although higher this Richardson number is still below one therefore suggesting the density stratification isn’t strong and that some mixing and turbulence is still present. Below 3 meters the temperature profile becomes more homogeneous creating Richardson numbers less than 0.25 suggesting shear is high and/or density stratification is weak so mixing occurs.
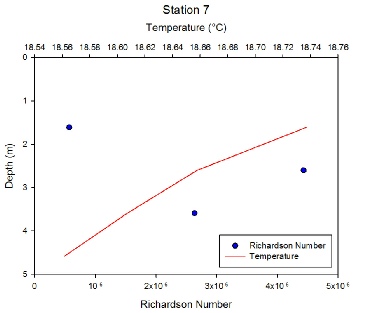
Station 7
Overall the Richardson number for this station is very low, it is less than 0.25 suggesting there is turbulent mixing occurring in the water column. Also the temperature of the water column only changes by 0.19ᵒC with depth, there is no sharp gradient in temperature again suggesting the water column is mixed. Station 7 was the shallowest area sampled therefore friction between the tidal flow and the sea bed and friction between the tidal flow and riverine flow creates high sheer and mixing.
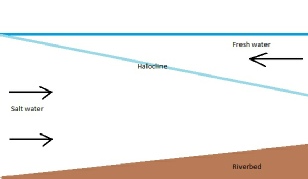
Fig.4: Richardson number for Station 1
Fig.5: Richardson number for Station 2
Fig.6: Richardson number for Station 3
Fig.7: Richardson number for Station 4
Fig.9: Richardson number for Station 6
Fig.8: Richardson number for Station 5
Fig.10: Richardson number for Station 7
Disclaimer: The views expressed above are the opinion of the authors only and NOT that of University of Southampton or National Oceanography Centre, Southampton.
