

Chlorophyll
Referring to Fig.1, it is clear that chlorophyll concentration is increasing upstream, as it increases with the stations. Stations 1, 2 and 3 show a homogeneous profile, where chlorophyll is constant throughout the water column. Stations 4 and 5 show a constant concentration then a sharp decrease with depth. This implies that the phytoplankton do not acquire sufficient light in order to photosynthesise. Station 6 and 7 both show a decrease in surface waters implying a lack of nutrients, however, station 6 then shows an increase in chlorophyll with depth towards the sea bed where there are sufficient nutrients. Station 7 shows decreasing chlorophyll which may imply that the conditions of the station were not suitable for photosynthesis, possibly due to increased turbidity.
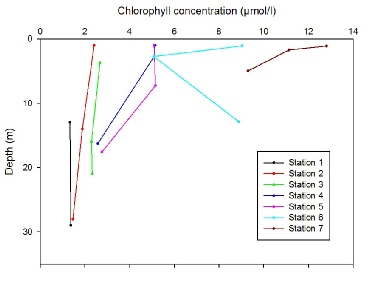
Fig.1: Chlorophyll concentration against depth for stations 1-
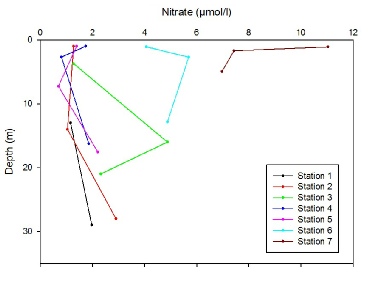
NO3
At stations 2, 4, 5 and 7 (Fig.2&3) there is a prominent decrease in nitrate in
the middle of the water column. This corresponds with the chlorophyll maximum for
stations 4 and 5 suggesting that the nitrate is being depleted due to enhanced phytoplankton
growth. For station 1 the water samples taken are deeper and therefore they have
bypassed the chlorophyll maximum. For stations 3 and 6, the nitrate concentration
peaks in the middle of the water column. Station 3 is influenced by a riverine input
which may be the cause of the increased nitrate concentration. Station 6 is also
in close proximity to a riverine source, potentially causing the increase in nitrate
here. Station 7 shows a water column that is rapidly depleted in nitrogen, possibly
due to the shallow euphotic zone caused by turbidity from the riverbed and increased
phytoplankton growth. Station 7 shows the highest nitrate concentrations due to a
run off from land. It is clear from the profile that further upstream, more nitrate
is available.
Fig.2: Nitrate concentration against depth for stations 1-
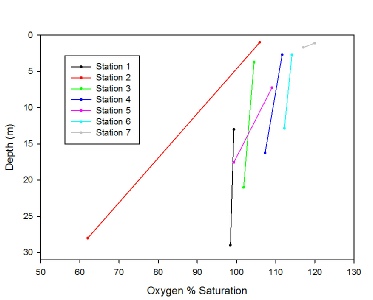
Oxygen % Saturation
Fig.4 shows that oxygen changes throughout the water column and along the estuary.
The greatest change is seen at station 2, where oxygen was sampled at the deepest
part of the estuary (27m), and hence photosynthesis decreases with depth, removing
the source of oxygen to this point of the water column. The line shows a linear trend,
with oxygen slowly decreasing with depth. This is to be expected, as with increased
depth comes decreasing light, and hence photosynthesis decreases with depth. Lower
oxygen in deeper waters indicates decomposition is occurring, most likely from the
recent spring bloom. High oxygen at the surface would also be due to gaseous exchange.
At stations 3-
Fig.4: Percentage oxygen concentration against depth for stations 1-
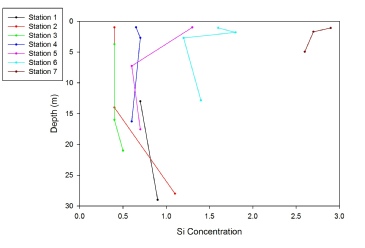
Silicon
Referring to Fig.5&6, as with the other mixing diagrams, a river end member of 88.65 µmol/l was calculated by averaging the three riverine end members provided, due to there being three major rivers flowing into the Fal this seemed the best way to calculate the river end member, though this may not be accurate given the large variations between the end members of each river. The marine end member provided from Station 1 had a value of 0.8 µmol/l. Although it is difficult to interpret this diagram due to the points not being evenly distributed along the line, there does appear to be a degree of unconservative behaviour through removal as the distance from the Theoretical Dilution Line (TDL) increases with increasing salinity. Silicon (or silicate) is a major nutrient for some photosynthetic organisms, in particular for diatoms who form their frustules primarily from silicate, such as Diatoms and Radiolarians. It is therefore likely that in an area of high primary production, such as at the top of the estuary, silicate will be removed from the system. There is clearly a strong gradient between the concentration of silicate at the riverine end members and marine end members, with the riverine Silicon concentrations being at least 70 µmol/l higher than the marine concentrations. The high concentrations of silicate in the freshwater may be a result of river and terrestrial run off or sewage, industrial and agricultural wastes that is not present in saline water33. However this change could be due to silicate form the rocks entering the river through groundwater flow and surface run off.
Fig.5: Silicon concentration against depth for stations 1-
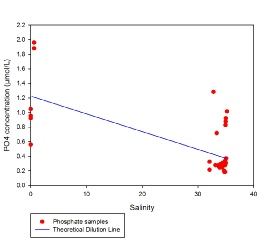
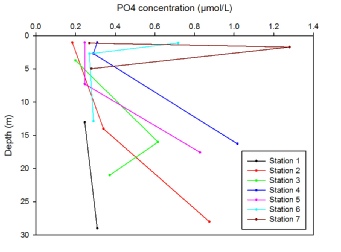
PO4
Fig.7&8 illustrates a general trend of increasing concentration with depth, with a dip in phosphate at approximately 5m depth. This corresponds to the phytoplankton maxima where phosphate removal would be greatest, and an increase of phosphate with depth is expected due to remineralisation and lower removal due to phytoplankton. However, there are a couple of stations which don’t follow this trend, namely stations 3 and 7. Station 3 shows a relatively sharp increase in phosphate at 16m and station 7 shows a marked increase in phosphate at 1.7m to the highest recorded value of 1.28µmol/L before rapidly falling to surface levels. The discrepancy at these stations could be due to the mixing of the freshwater and saline water masses as the tidal state changes leading to unexpected concentrations. Alternatively it could be explained by errors in the instruments used in recording.
Fig.7: Phosphate concentration against depth for stations 1-
Disclaimer: The views expressed above are the opinion of the authors only and NOT that of University of Southampton or National Oceanography Centre, Southampton.

Fig.3: Nitrate estuarine mixing digram for Fal estuary
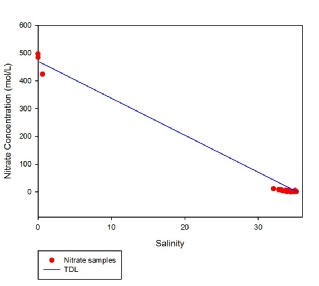
Fig.6: Silicon estuarine mixing diagram for Fal estuary (zoomed).
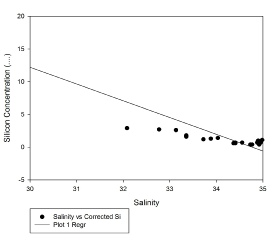
Fig.8: Phosphate estuarine mixing diagram for Fal estuary.