Falmouth Group 8

DISCLAIMER! This website does not necessarily reflect the views expressed by the National Oceanography Centre or any of its staff.

Station 8

Data from station 8 does not allow a vertical profile, as it was too shallow allowing only one depth to be recorded. Data recorded has been tabulated and used in estuarine mixing diagrams.

Nutrients-Table

Fluorescence

Error range:  0.555-0.501 = 0.054

Average fluorescence in the surface water is 0.372 at 0.23m and increases with depth to 0.527 at 1.22m an increase of 0.054. As the water is very shallow the increased fluorescence at 1.2 meters could be a result of prop wash.

Data from station 8 does not allow a vertical profile to be made as it was too shallow allowing only one depth to be recorded. Data recorded has been tabulated and used in estuarine mixing diagrams. Data from station 8 does not allow a vertical profile to be made as it was too shallow allowing only one depth to be recorded. Data recorded has been tabulated and used in estuarine mixing diagrams.


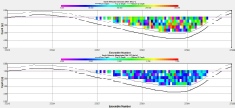
ADCP Transect-Figures 1,2&3

With such shallow depths encountered here, no tidal flow can be defined here.


Click graphs to enlarge

Nutrient

Salinity

Depth (m)

Concentration (μmol/L)

PO4

29.1

1.24

0.007


28.9

1.25

0.007


29

1.245

0.007

Silicon

29.1

1.2

17.933


28.9

1.2

17.822


29

1.2

17.878

Nitrate

29.1

1.24

109.759

Top

Black rock time series →