
Falmouth Group 8

DISCLAIMER! This website does not necessarily reflect the views expressed by the National Oceanography Centre or any of its staff.
Station 4


The range in transmissivity values was 4.09-
Transmissivity-
The vertical profile observed at station 4 (50° 12.126N, 005° 02.456W) shows an almost
perfect expected nutrient distribution. Salinity is uniform at 34.2 for the first
6.0m, then increases to a high of 34.7 at 12.9m. Nitrate, phosphate and silicon values
follow almost identical trends, falling from 5.75 mmol/L, 1.93x10-
It in interesting to note that any major changes observed in these
vertical profiles occur 5m above the estimated 1% irradiance depth calculated, and
not within its vicinity as would be expected.
Nutrients-
Fluorescence-
Error Range: 0.466-
Fluorescence increases from an average of 0.384 at 1.2m to 0.438 at 5.7m. Between 6 and 9m fluorescence shows a slight decrease of 0.009. At 10 meters the average fluorescence increases to 0.464 and continues to increase to 12.9m where the average fluorescence is 0.485.
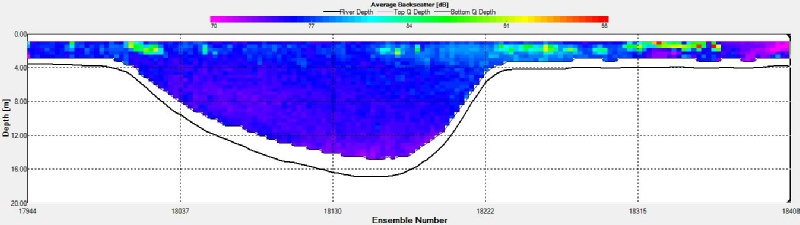
ADCP Transect-
Because of the shallower depth range sampled here, backscatter shows a pattern of maximum readings occurring at the surface layer: up to over 91 dB. Minimum readings of around 70 dB occur at the deepest depth of approximately 14 m.
With regards to north velocity, the tidal flow at the surface layer of the estuary
was proceeding outwards in a southerly direction at -
From the ship track it can be observed that the flow velocity is stronger around the surface layer (2.66 m) than the flow velocity at 12.26 m depth.
Click graphs to enlarge