

DISCLAIMER! This website does not necessarily reflect the views expressed by the
National Oceanography Centre or any of its staff.


The range in O2 saturation values is approximately 97-110%. Although there is a
general positive linear regression with salinity the data points show random variation
between salinity 32-36 (Figure 1). In addition, between salinites 28-32 only one
sample was taken, which gives little indication of a pattern further up the estuary.
In Figure 2, most of the data values have been distributed between densities of 1023-1027
kg/m³, although it is notable that the data value taken from an approximate salinity
of 28 occurs in a similar position. So likewise whilst it initially seems possible
for O2 saturation to exhibit a positive relationship with density, there is significant
random variation for most of the dataset. The highest O2 saturation value of over
109% also did not occur at the greatest density value of approximately 1027 kg/m³.
Overall there has been little evidence to suggest that there is a trend with O2 along
the length of the estuary or with depth. Oxygen within the water column is primarily
affected by the processes of respiration and photosynthesis from the biota. This
means that oxygen levels can vary along an estuary depending on the limiting levels
of nutrients and the number of phytoplankton and grazing zooplankton present.
Dissolved Oxygen-Figures 1&2
The estuarine mixing diagram for nitrate (NO3-) mixing in the Fal estuary shows nitrate
to follow a non-conservative pattern in the researched area. Values from 28.9 to
35.0 appear to show removal of nitrate along the estuary and this has several explanations.
Falmouth has large areas of agricultural land surrounding the estuary and many of
its tributaries, and these often utilise nitrate-based fertilisers to increase crop
yield. Excess nitrate is quickly incorporated into the pore-waters, and rainwater
can leach these into the estuary body. The nitrate rich waters are rapidly depleted
by phytoplankton blooms, who incorporate this nutrient for use in protein synthesis
and the formation of nitrogenous bases in DNA replication, so observed values, although
initially high, are rapidly diminished downstream. These blooms are seasonal, and
from previous research appear to be dominated by dinoflagellates at this time of
year (26th June to 5th July) .
The estuarine mixing diagram for silicate (SiO32-) mixing in the Fal estuary shows
conservative behavior in the researched area. Silicate can behave both conservatively
and non-conservatively depending on the biology and geology of the area, and so this
pattern is to be expected. Cornwall is well known for its geology, and is dominated
by granite bedrock (Hill & Macalister, 1906). This acidic igneous rock is naturally
rich in silicon compounds (including the common silica-rich rhyolitic glass, obsidian)
(Santos & Wainerdi, 1968), and so silicon addition to pore waters is common. This
addition is countered evenly by the biological uptake of silicon into marine organisms
along the estuary length. Various phytoplankton groups, such as diatoms and silicoflagellates,
utilise biogenic silica (SiO2) to form tests of opal (SiO2·H2O) for protection. The
dominance of these in seasonal ‘blooms’ leads to conservative and non-conservative
behavior, and this leads to results like the one seen here.
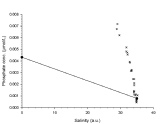
The estuarine mixing diagram for phosphate (PO43-) shows strong non-conservative
behavior for the sample area. Results observed between salinities of 28.9 and 35.3
are distributed far from the theoretical dilution line, and appear to show rapid
addition of phosphorus over the length of the estuary. This phosphate has many possible
inputs, and it is theorised that it is a combination of these that lead to the large
differences seen in this study. Phosphate is often found in commercial fertilisers,
and with the large amount of Cornish land given over to agriculture these compounds
often leach into the pore-waters. This results in the rapid addition of phosphorus
to the water column, and if this is not taken up (or not taken up fast enough) by
biological activity then a large surplus will rapidly develop. During the spring
diatom bloom phosphorus reserves are rapidly taken up by diatoms, which utilise phosphate
compounds for phospholipid structural cells and in the maintenance of buoyancy, but
in April/May when these blooms break down phosphate reserves can rapidly regenerate.
The inclusion of various external input sources was also a major factor at this part
of the estuary, and the joining of two major tributaries near the sampling location
could have provided unusually high levels of nutrient input.

Area of estuary:
An estimation of the estuaries area is outlined by the red boxes in figure 1. Distances
were calculated using ‘Google Earth’ and the area was calculated to be 16.11km2.


The average depth of the estuary was calculated using our CTD profiles and found
to be 8.81m
Therefore:


We are in an M2 tidal area so the tidal time is 12.42h.
Therefore, flushing time is equal to:

Where
Tres=Residence time
Smean= Mean salinity= 33.2 PSU
Ssea= Salinity sea= 35.2 PSU
R= Freshwater input= 0.219m3s
Therefore residence time is:


