Falmouth 2015 -
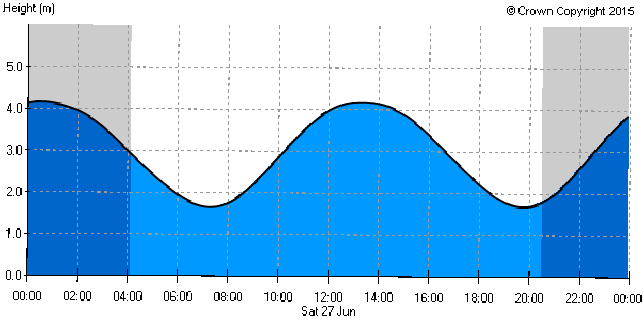
Figure 1: Tidal curve for Saturday 27th June 2015
Introduction
Aim: To observe changes in different physical, chemical and biological parameters across the tidal cycle at a static point in the Fal estuary.
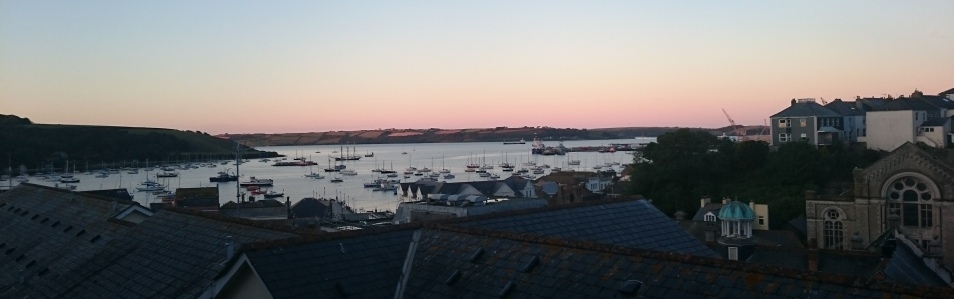
Measurements were taken every half hour from the King Harry Ferry Pontoon at 50°12’57.73’’N,
005°01’39.76’’W from 11:00 UTC until 15:00 UTC on the 27th June 2015. Weather was
warm, dry and wind speed was low; cloud cover increased from 2/8 to 7/8 cover later
in the afternoon. Falmouth has a semi-
Measurements taken: (See below for results and References)
- Depth Measurements
- Light Meter
- Current Meter
- YSI Probe (measuring temperature (°C), conductivity, salinity, turbidity (FNU and ug/L) , oxygen saturation and concentration (% and ug/L), pH and Chlorophyll concentration (RFU)).
- Chlorophyll surface samples which were later processed in the lab.
Figure 2 shows how water depth surrounding pontoon increased towards ~13:30 UTC which is due to the flood tide moving up the estuary to the pontoon. It ties in perfectly with Figure 1, showing that high tide was as 13:17 UTC. All samples taken before this were on flood tide (with increasing saline water into our sampling area) and those after on the ebb tide. This is a very crude method of showing where in the tidal cycle we were.
To calculate the % of light attenuated a light meter was used. There was one sensor on the pontoon itself detecting surface irradiance. Another sensor was the lowered into the water column and the light detected was recorded at each meter depth. For each depth the proportion of light attenuated was calculated ad plotted against time.
Light was seen to decrease with depth as it is attenuated by the water and suspended particles (See Figure 3). At all times, almost all of the surface irradiance was attenuated by 3m depth. During the time surrounding high tide, light was seen to penetrate further with ~80% of light being attenuated at ~2m depth. After high tide, light penetrates less far into the water column with 80% of light being attenuated at 1m. However this is still penetrating further than between 11:00 and 12:00 UTC where almost ~100% of light was attenuated within a few cm’s.
The % attenuation decreased around high tide as this was slack water. Previous to
this, the tide had been flowing in and friction with the sea bed had been re-
Current speed and direction changes with depth and time are represented by the arrows
on figures 5, 6 and 7. From 11:00-
According to tidal predictions, low tide was estimated at 08:18 and high tide was estimated at 14:20 UTC. This provides some insight into the variation in tidal speed from 11:00 UTC to 15:00 UTC. (Figure 4)There is some fluctuation at the different depths surveyed across the span of the water column from 0m to 5m. However, the average pattern of the water collumn shows an initial decrease in tidal speed from 11:00 UTC until 13:00 UTC which demonstrates slowing down in anticipation of the changing of the tide.
The average speed then increases dramatically in speed as the high tide rises up until 14:30 UTC where tidal speeds start to decrease as the estuary is now at its highest tide. This increase is much greater at lower depths, with surface waters seeing less increase in speed at high tide. This is perhaps due to the stratification of the estuary, where surface waters are denser due to river run off and freshwater inputs.
Temperature: High tide occurs at 13:17 UTC and the temperature plot displays that
before high tide at 12:30 the water is 16.21°C followed by a decrease in temperature
with depth at 13:30 of 15.79°C due to cooler water flooding into the estuary. Over
the four-
Salinity: A similar pattern as seen in the temperature contour plot is observed in
the salinity plot. There is an increase in salinity with high tide. Before high tide
at 12:30 the salinity of the water was 34.02 PSU then at 13:30 the salinity increased
to 34.46 PSU. After high tide salinity at 2m depth at 14:30 had dropped to 33.90
PSU; this co-
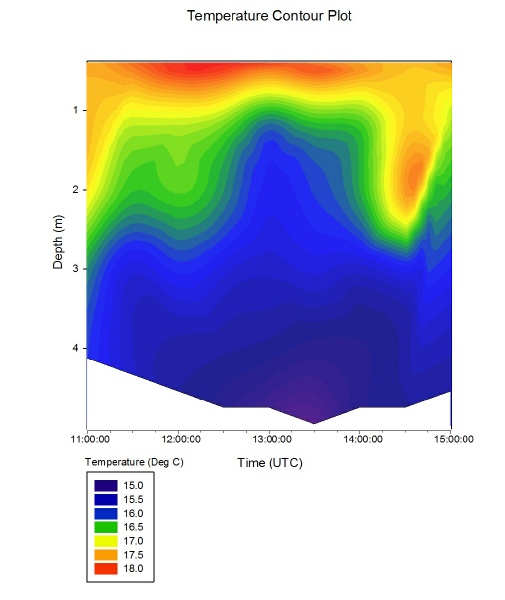
Figure 3: Temperature against depth through time (Click to Enlarge)
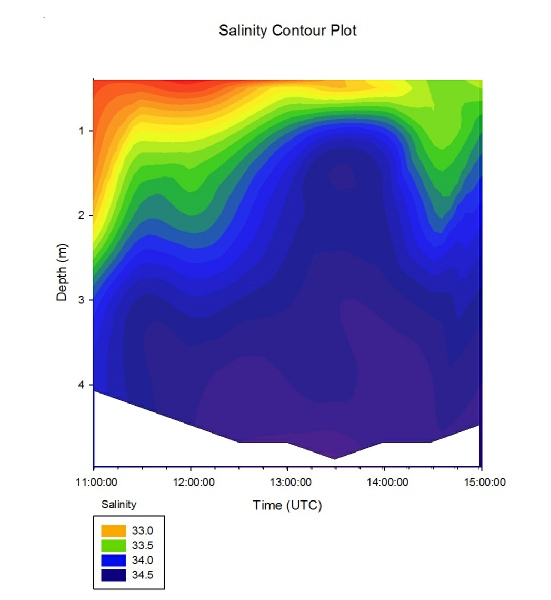
Figure 4: Salinity against depth through time (Click to Enlarge)
Dissolved Oxygen: Dissolved oxygen (DO) is higher in surface waters, particularly from 11:00 till 12:30 where it peaks at 12:30 at a depth of 0.46m with a value of 161.3%. Just after high tide at 13:30 DO decreases to 156.0% at 0.504m at 11:00 due to the influx of saline water containing less oxygen.
Around an hour after high tide at 14:30 DO increases at deeper depths-
pH: Follows a very similar pattern to dissolved oxygen %, with surface waters being less acidic than deeper water. With the influx of saline water at high tide, pH decreases, and then increases with the commencement of ebb tide. At around 2m depth pH decreases from 8.28 at 12:30 to 8.22 at 13:30 and then increases to 8.29 at 14:30.
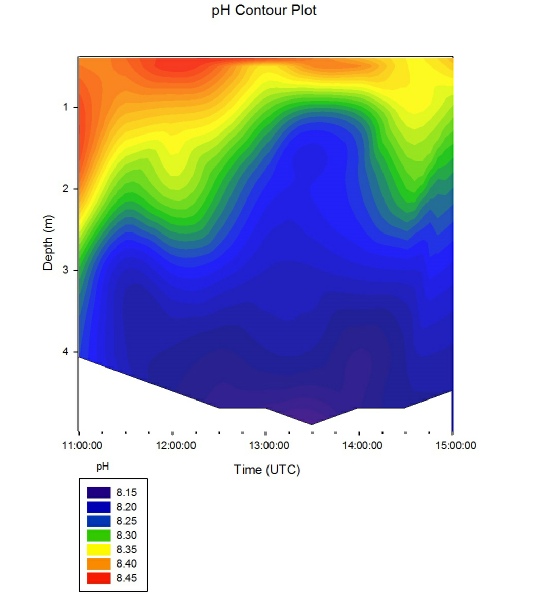
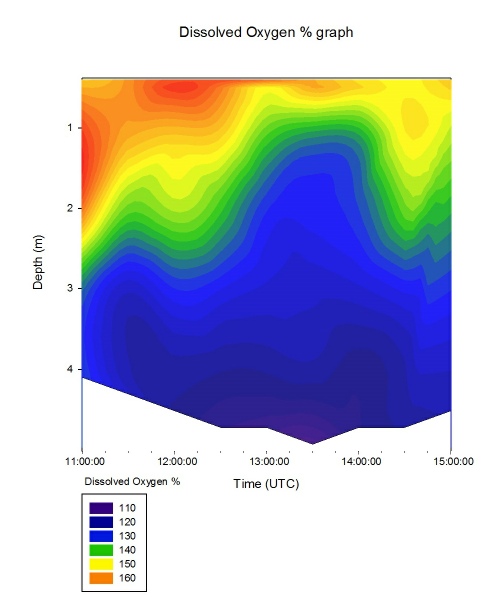
Figure 5: pH against depth through time (Click to Enlarge)
Figure 6: Dissolved Oxygen against depth through time (Click to Enlarge)
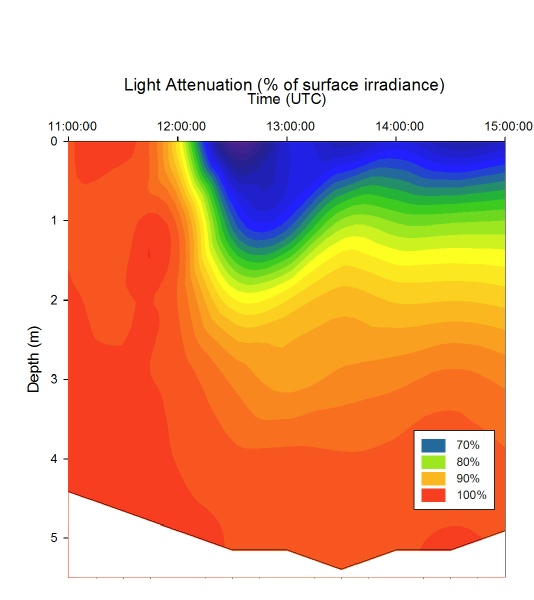
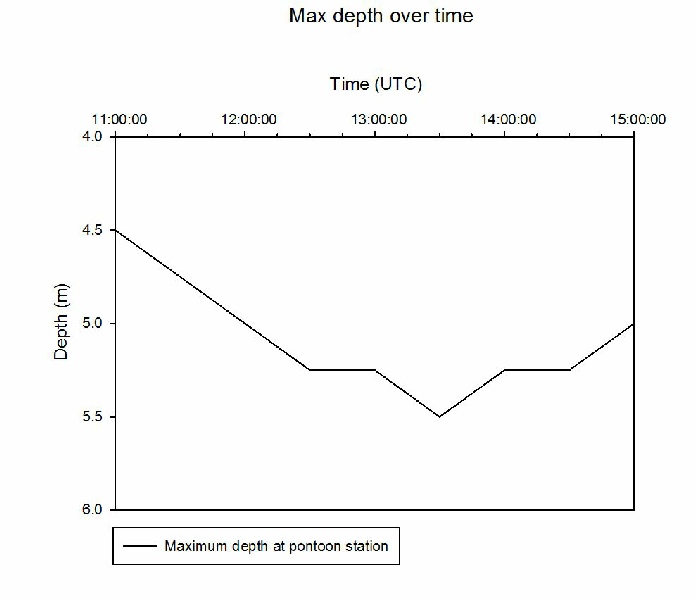
Figure 2: Depth changes with time taken form the pontoon sing the rope from the light meter (Click to enlarge)
Figure 3: Light attenuation as a % of surface irradiance against depth and time (Click to enlarge)
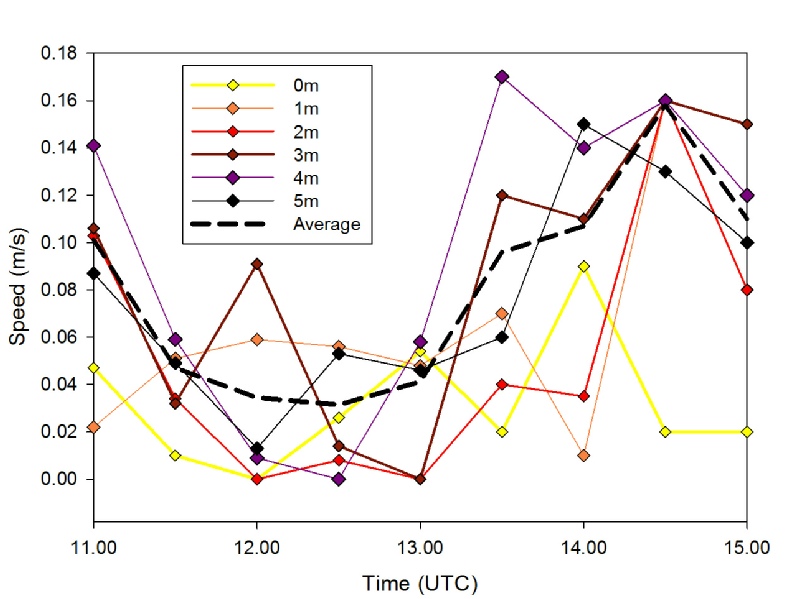
Figure 4: A graph showing the variation in speed (m/s) from 11.00 to 15:00 UTC at
the pontoon at 50 12’ 57.62 N 5 01’39.65 W, taken at metre intervals down to the
maximum depth of 5m by use of a current metre. The speed at each depth with time
was plotted separately (0m-
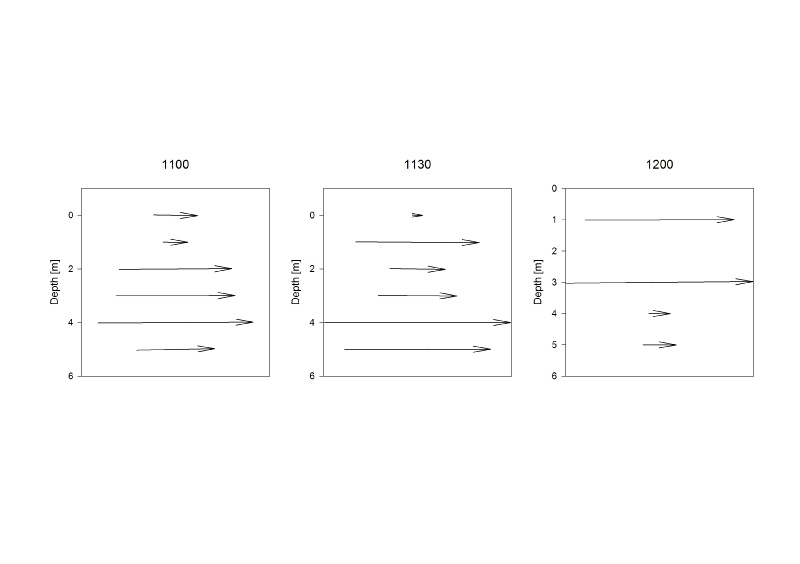
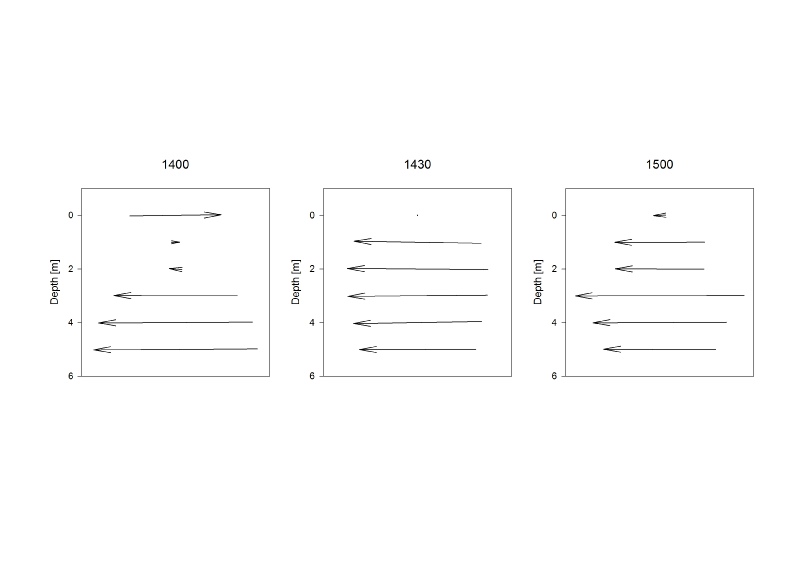
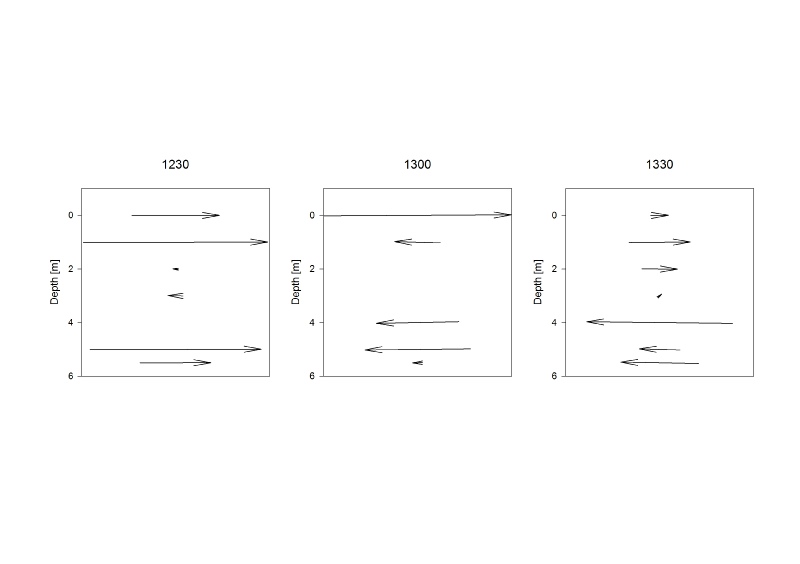
Figures 5,6 & 7: Flow magnitude and direction profiles (Click to enlarge)
Hydrographic Office Admirality Easy Tide. (2015). Tidal Prediction Chart. Available: http://www.ukho.gov.uk/easytide/easytide/ShowPrediction. Last accessed 27th June 2015.
Disclaimer: The views expressed here are not associated with those of the National Oceanography Centre Southampton or the University of Southampton.
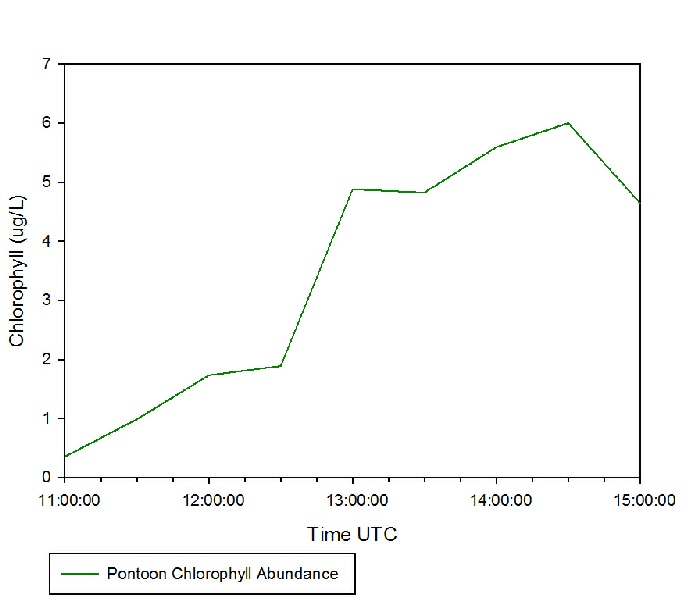
Figure 7: Changes in Chlorophyll(Click to Enlarge)
Chlorophyll Samples
On the day of our chlorophyll survey high tide occurred at 13:00 UTC. From the start of our survey at 11:00 UTC to high tide there is a steady increase in chlorophyll abundance due to the flooding of the tide into the estuary. There is a peak chlorophyll abundance at 14:30 UTC followed by a decrease to 4.64ug/L. This corresponds to slack tide at 14:30 UTC and the ebb tide flushing out chlorophyll from the pontoon station.