
Falmouth 2015 -
The nitrate depth profile shows the same progression as the silicon depth profile
in that it gives an example of how mixing along the estuary occurs at the stations
closest to the marine end member. Stations 36, 37 and 39 exhibit less mixing due
to their location furthest being up the estuary and experiencing less tidal force.
Stations 36-
A relatively small range in phosphate concentrations were recorded within all 8 stations
(0.10-
Silicate, nitrate and phosphate are all essential nutrients for biological processes in estuarine waters. For example, silicate is needed as a component of diatom frustules, nitrogen is needed for all amino acids and phosphate forms strong bonds in biology’s own energy currency ATP. Riverine sources provide the dominant inputs of nutrients into the marine system. However, these inorganic constituents behave differently depending on the interactions between physical and biological factors ie planktonic uptake The degree of mixing of freshwater nutrient inputs and seawater in the estuary, determines how the concentration of nutrients varies with salinity. (Liss and Pointon, 1973).
From figures 1,2 and 3 the TDL (theoretical dilution line) shows that nitrate, phosphate and silicate follow the expected trend of having a significantly higher riverine end member concentration then the seaward end member at the mouth of the estuary. This is due to the different chemical composition of seawater and river water, due to the high level of riverine input as mentioned above. For example rivers have two orders of magnitude more dissolved silica than the surface ocean (Demaster, 1981).
Silicate, phosphate and nitrate concentrations at all stations sampled fall below the TDL, suggesting removal of these nutrients. This could be due to flocculation, biological removal and temporal variation in the end members, riverine inputs and pore waters. The weather conditions being dry and hot leading up to sampling could have potentially caused increase in the salinity of the seawater end members. This could have potentially skewed the TDL, causing sampled stations to falsely appear to be experiencing removal.
There is a general decreasing trend in oxygen concentration with depth. The depth
profile at station 39 shows a decrease in oxygen concentration from 326.9 µmols/L
at the surface depth of 1.1m, to 236.0 µmols/L at a depth of 12.8m. The decrease
may be due to the water at increasing depths being further from interaction with
the atmosphere at the air-
Stations 40/41 and 39 share similarly high chlorophyll values at the surface of ~5
ug/L. At station 40/41 there is a subsurface chlorophyll maxima of 6.112 at 4.4m,
chlorophyll then decreases until the maximum sampling depth of that station, 3.92
ug/L at 10.4m. Conversely station 39 has a decrease in chlorophyll concentration
with depth until 4.2m with a concentration of 2.7 ug/L, after which it increases
again to 3.46 ug/L at 12.8m. All other stations show a slight variation with depth
but generally remain near constant with depth and have relatively low concentration
of between 0-
In conclusion as expected chlorophyll concentrations are lower at the seaward end
of the estuary and are greater in the mid-
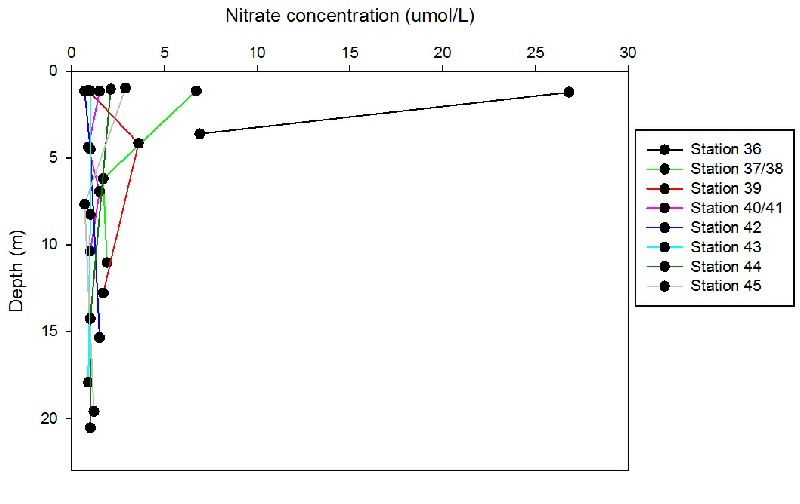
Figure 23: Nitrate concentration against depth (Click to enlarge)
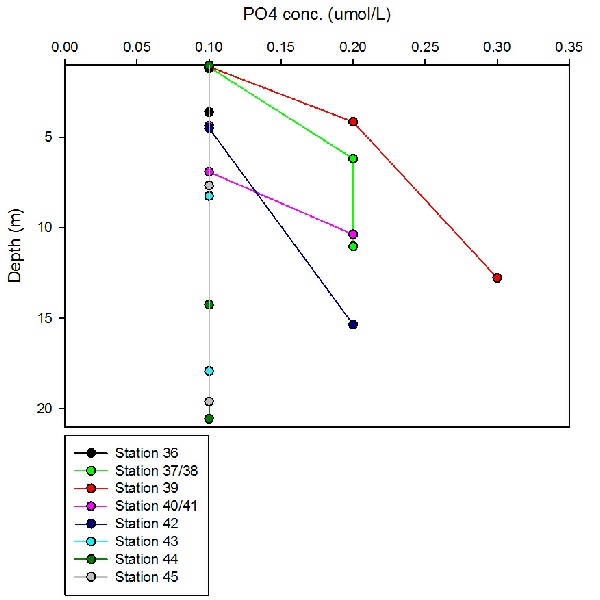
Figure 24: Phosphate concentration against depth (Click to enlarge)
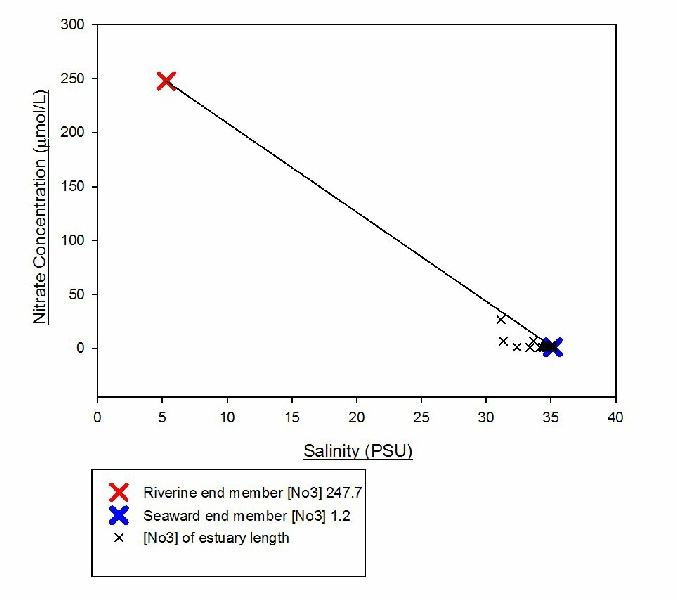
Figure 25: Nitrate Estuarine Mixing Diagram (Click to enlarge)
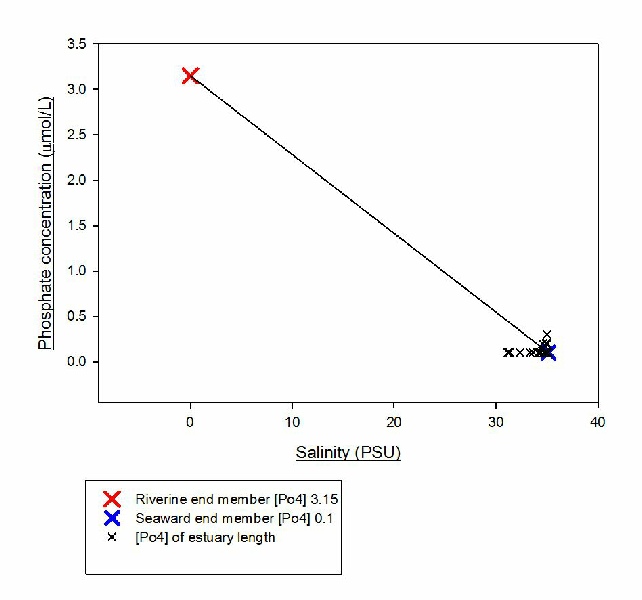
Figure 26: Phosphate Estuarine Mixing Diagram (Click to enlarge)
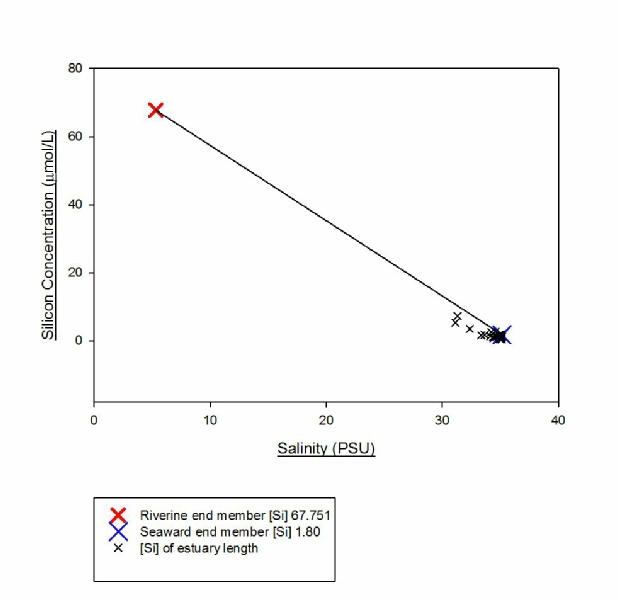
Figure 27: Silicon Estuarine Mixing Diagram (Click to enlarge)
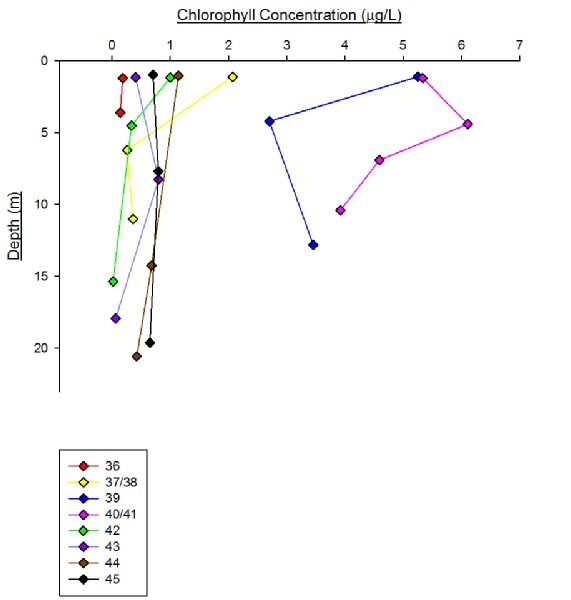
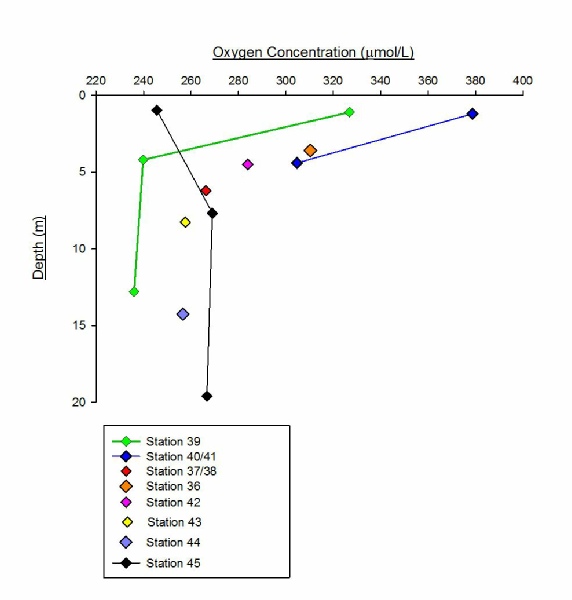
Figure 28: Chlorophyll against depth (Click to enlarge)
Figure 29: Oxygen against depth (Click to enlarge)
References
DeMaster, D. (1981). The supply and accumulation of silica in the marine environment.
Geochimica et Cosmochimica Acta, 45(10), pp.1715-
Kamatani, A. and Takano, M. (1984). The behaviour of dissolved silica during the
mixing of river and sea waters in Tokyo Bay. Estuarine, Coastal and Shelf Science,
19(5), pp.505-
Liss, P. and Pointon, M. (1973). Removal of dissolved boron and silicon during estuarine
mixing of sea and river waters. Geochimica et Cosmochimica Acta, 37(6), pp.1493-
Disclaimer: The views expressed here are not associated with those of the National Oceanography Centre Southampton or the University of Southampton.
The silicon depth profiles from stations 36 – 45 illustrate an example of how mixing progresses along an estuary, with most stratification occurring in the first 2 stations furthest along the estuary (With a 3.6 umol/L drop in 2.4m at station 36 and a 4.6 umol/L drop in 5.1m at station 37/38). Because of its distance upstream, these stations are where the least amount of tidal influence is expected. Mixing increases with each station until almost complete conservative behaviour is observed in stations 44 & 45 (with no more of a 1 umol/L change throughout the entirety of both vertical profiles). These stations are the lowest down the estuary and closest to tidal influence (and therefore where the most mixing would be expected to occur).
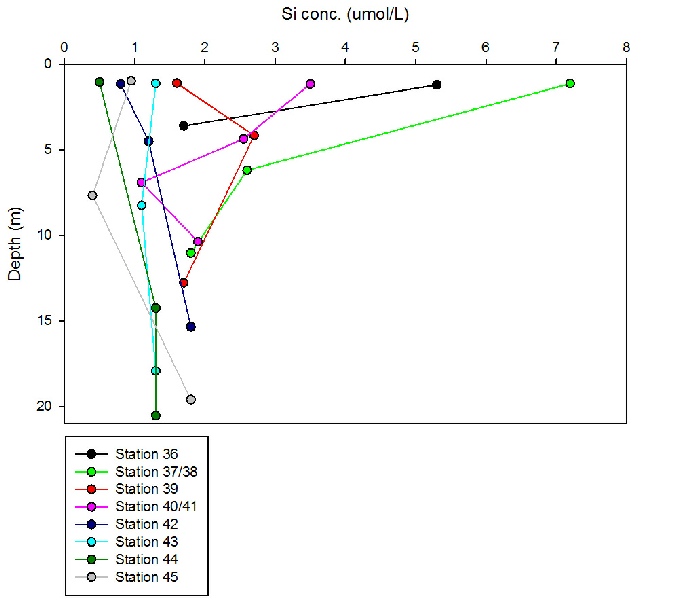
Figure 22: Si concentration against depth (Click to enlarge)