Falmouth 2015 -
Introduction
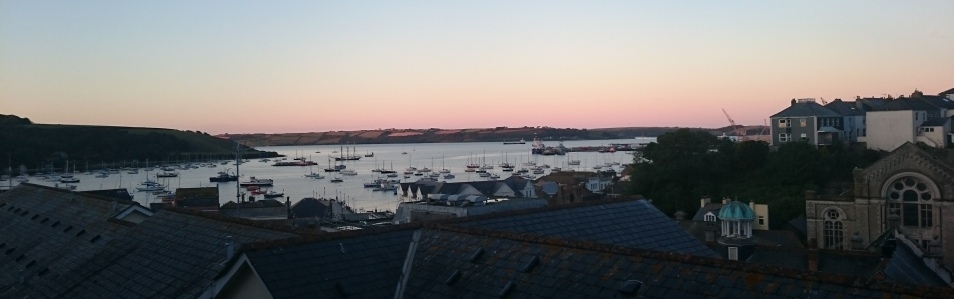
The Falmouth harbour is estimated to be the third largest natural harbour in the world and is the deepest in Western Europe (falmouthport.co.uk).
Based on studies carried out during previous field trips and scientific work done
in the area (R.M. Crawford et al 1979, L. Dupont et al 2009 and A. C. Birchenough
et al 2002), it would be expected that the area would contain live Maerl beds, a
coral-
Aim: To investigate the area just outside the main harbour (50°9.31.71N, 005°2'56.98W) with the aim of producing a detailed habitat map via side scan sonar and video transects. Four transects were completed using the side scan sonar and two video transects, in areas of particular interest following a review of the side scan data.
Journals:
A.C. Birchenough, S.M. Evans, C. Moss and R. Welsh (2002): Re-
L. Dupont, F. Viard, M.J. Dowell, C. Wood and J.D.D. Bishop (2009): Fine-
R.M. Crawford, A.E. Dorey, C. Little and R.S.K. Barnes (1979): Ecology of Swanpool,
Falmouth: V. Phytoplankton and nutrients. Estuarine and Coastal Marine Science. Vo.l
9 Iss. 2 pp135-
Websites:
http://jncc.defra.gov.uk/page-
http://www.cornwallwildlifetrust.org.uk/conservation/position_statements/fal_docks_dedge_and_the_reference_ area_for_maerl. Accessed 26th June 2015
http://www.falmouthport.co.uk/commercial/htnl/history.php . Falmouth Harbour Commission
(2007) -
Hydropro navigation software was used to locate our 4 transects, each 1km long with 100m between each transect. Our sidescan sonar towfish was deployed behind the MTS Xplorer to map the bathymetry.
The sidescan sonar was towed at ~1m depth and had a swath of 75m. A print out of the bathymetry was processed for later analysis of bedforms and sediments.
Video footage was used to ground-
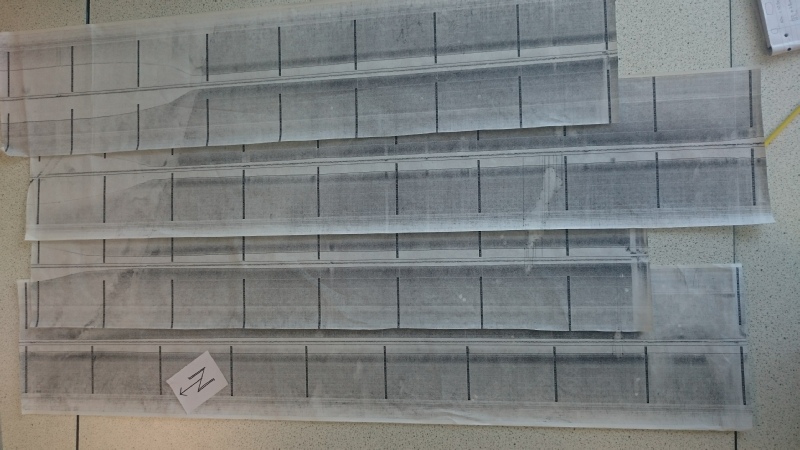
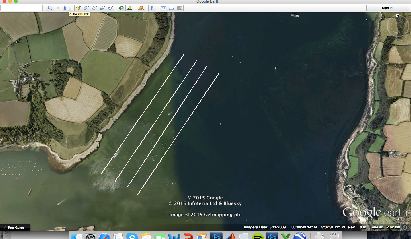
Figure 4: Sidescan trace from 25/06/2015 (Click to enlarge)
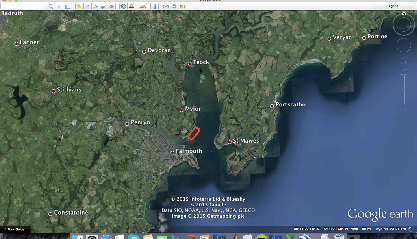
Figure 1: Area surveyed for habitat mapping on 25/6/2015
Figure 2: Locations of lines surveyed by the Sidescan on 25/06/2015
Zone 1—Backscatter here was much weaker than zone 6, shown by the lighter colour. Assuming towfish height is constant, the water column depth clearly increases by 20m. Looking at the admiralty chart (32) of Falmouth Harbour you can see that this corresponds to our survey track entering the Carrick roads channel area.
Zone 2—Zone 2 is characterised by crescent shaped distortions of the sea bed. These ridges have a spacing of 3.4m with each distortion having a length of around 11m and height of 1.1m. Their shape suggests possible anchor scarring given the area has unrestricted anchorage.
Zone 3—A lighter patch on the sonograph representing an area approximately 100m long and 30m wide suggests a softer substrate with less reflectance, likely to be a large patch of sandy, fine substrate.
Zone 4—A relatively small zone, found on the border of two transects. The light backscatter relative to the surrounding area and similar to that of zone 3 suggests a possible separated extension of this zone or another area of finer/sandy substrate.
Zone 5—Being found directly beneath the towfish track means the zone was not 100% observed. Again backscatter is weaker and shows a marked difference texturally and relative to the surrounding strong backscatter of zone 6.
Zone 6—This zone represent the dominant bed type with fairly uniform backscatter and ripple patterns across its area. Admiralty charts indicate that we should expect to see shells and calcareous weed. On transect 1 the distance between bedforms was measured to be 1.1m. We know that these bedforms are likely to be stable for more than a year due to our video footage showing Chondrus crispus which have a long lifespan reaching up to 6 years. Bifurcation in the bedforms suggests they were formed by oscillatory flow.
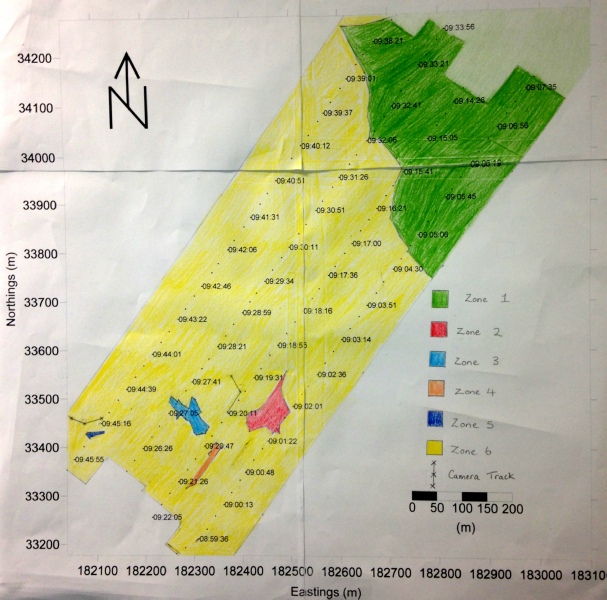
Figure 3: Habitat from 25/06/2015 (Click to enlarge)
Click here to download the final habitat mapping poster produced by group 1.
Disclaimer: The views expressed here are not associated with those of the National Oceanography Centre Southampton or the University of Southampton.