Falmouth 2015 -
Physical
Data collected from the CTD & ADCP deployed from RV Bill Conway.
Temperature, like salinity, changes in this stepwise fashion discussed. The seasonal
input of heat to the water, particularly in the fortnight proceeding data collection
means surface temperatures, dominated by riverine flow, are 2-
Tidal, wind or other physical mixing processes appear insufficient to distribute the heat input to the surface and so rather than changing smoothly with depth, temperature decreases in a series of narrow layers with shallow thermocline structures between them as was also found on in the salinity profiles.
Towards the mouth of the river where tidal and external physical processes become
more dominant the profile again becomes more well-
Salinity profiles show a trend that would be expected in the progression downstream
from highly stratified at station 36 to well-
Both our salinity and temperature profiles are characterised by a prominent stepped shape, with bands of water occurring in layers, approximately 2m deep, each with characteristic salinities and temperatures separated by sharp halocline and thermocline structures. This may be accounted for by the large number of tributaries influencing the water eventually running into the Carrick Roads and Fal Estuary (there are 5 main rivers and 20 or so minor tributaries). Each river appears to be carrying water with separate and characteristic temperature/salinity parameters into the Fal with very little mixing occurring between them.
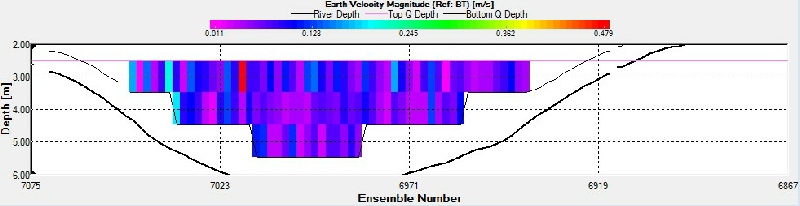
Station 36: The ADCP transect shows flow velocity at the station furthest up river
where the maximum depth is 4.96m. This transect shows one area of increased flow
velocity in the surface waters from 2.5-
The Richardson number quantifies the balance between the buoyancy force, controlled by the strength of stratification, and the flow gradient. A Richardson number above 1 suggest that stratification dominates and mixing is unlikely to occur. A value below 0.25, suggests that the effect of the shear in the flow dominates and mixing is likely to occur. Density change was calculated by subtracting the density at the shallow depth from the density at the deeper depth, this results in a negative Richardson number when the water column is unstably stratified. The magnitude of the negative Richardson number is not significant as the unstably stratified water will always convectively overturn.
The Richardson number was calculated at 1m depth intervals for stations 36-
Note: Some of the negative Richardson numbers may have been as a result of density being manually calculated from temp and salinity data taken from the CTD. In accuracy in the data used may have indicated density instabilities where in reality there were none.
Figure 5: Velocity Cross section at station 36
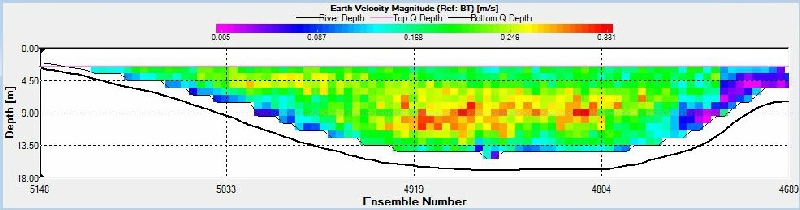
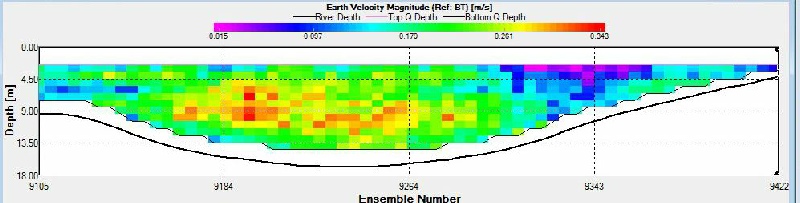
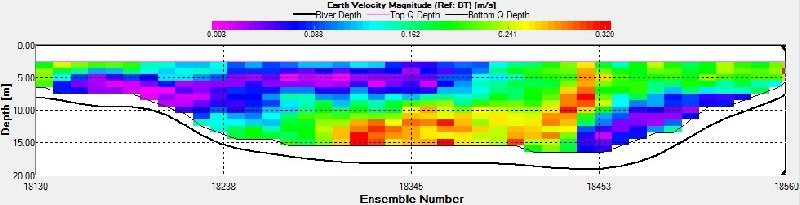
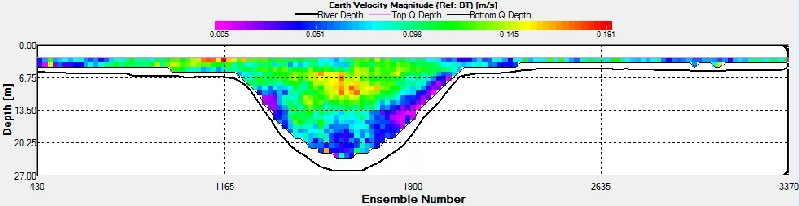
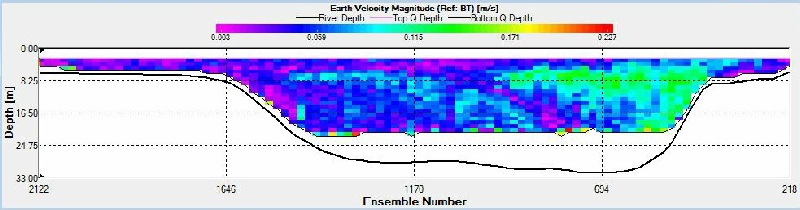
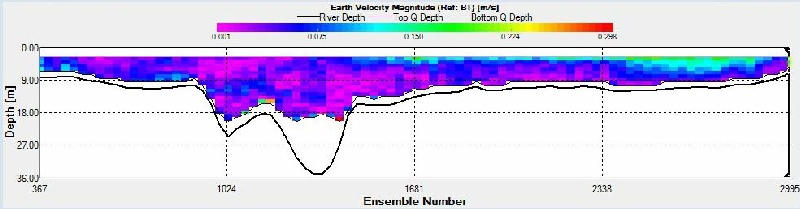
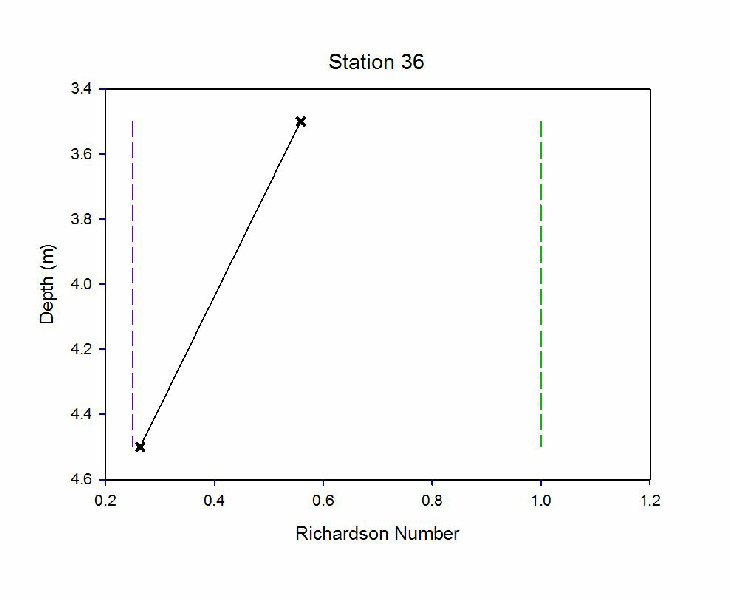
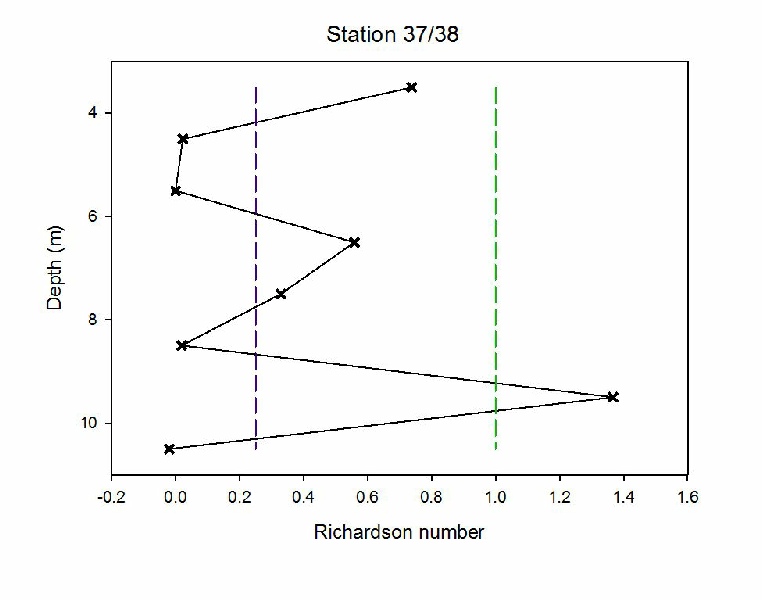
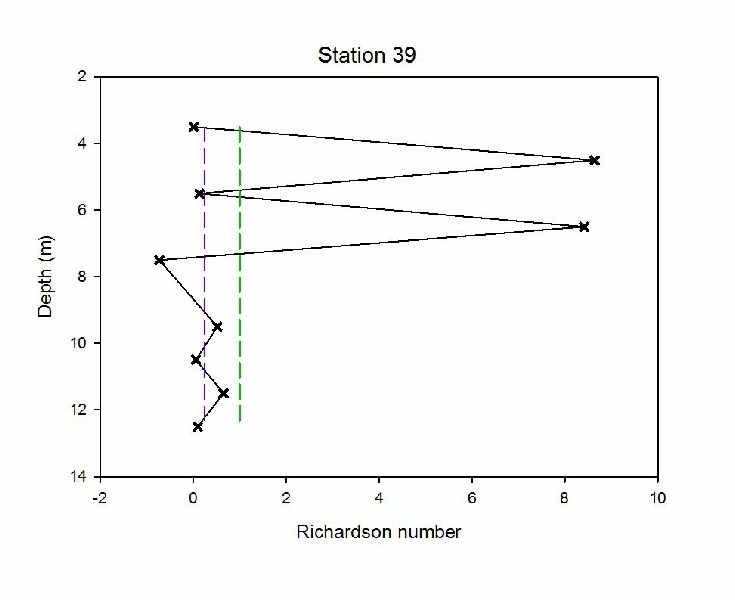
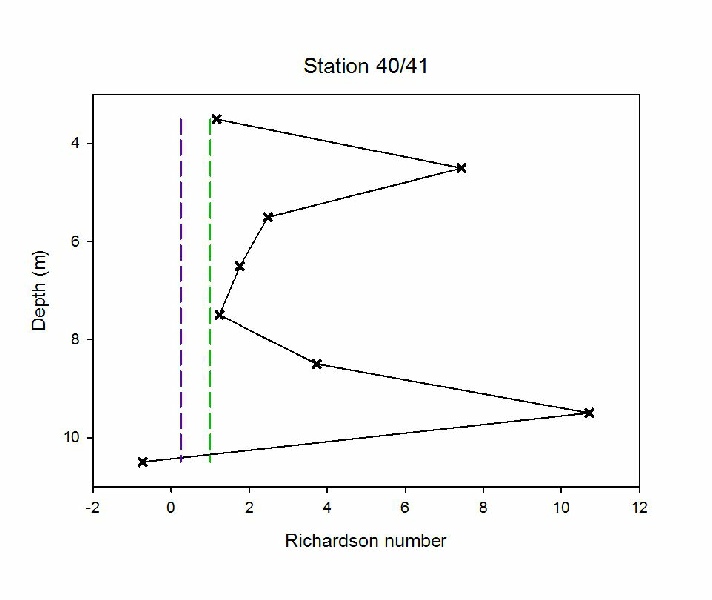
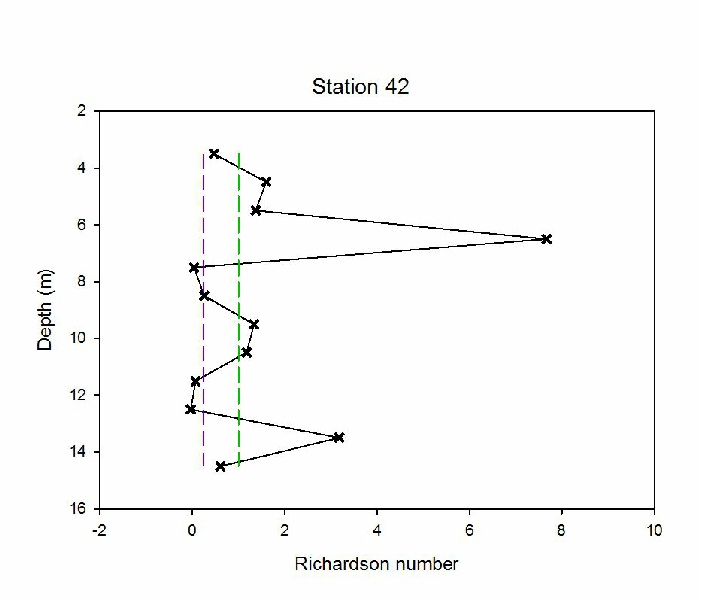
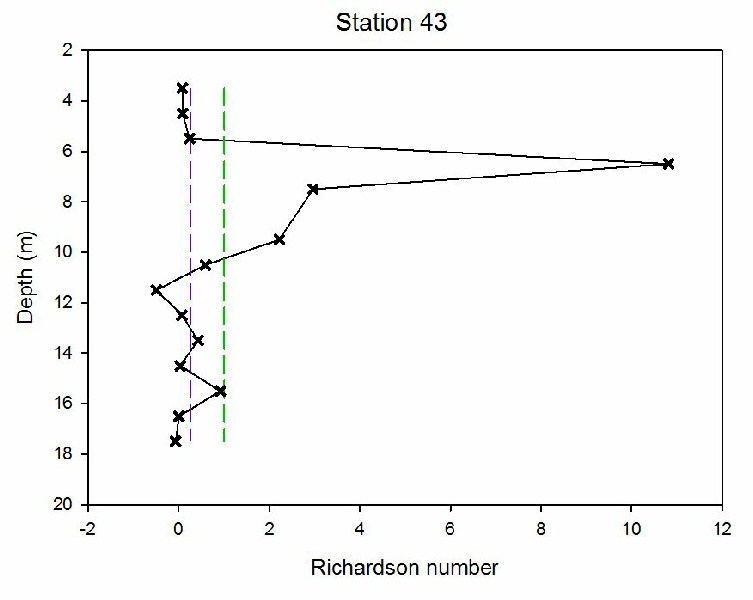
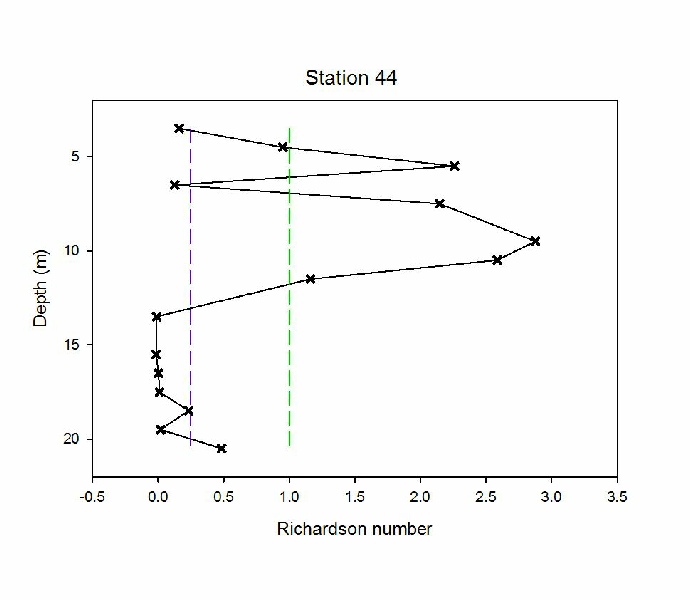
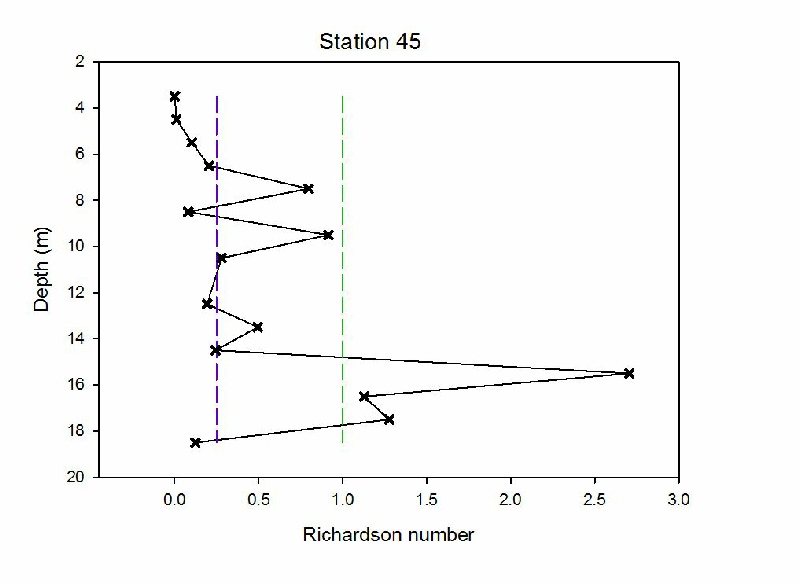
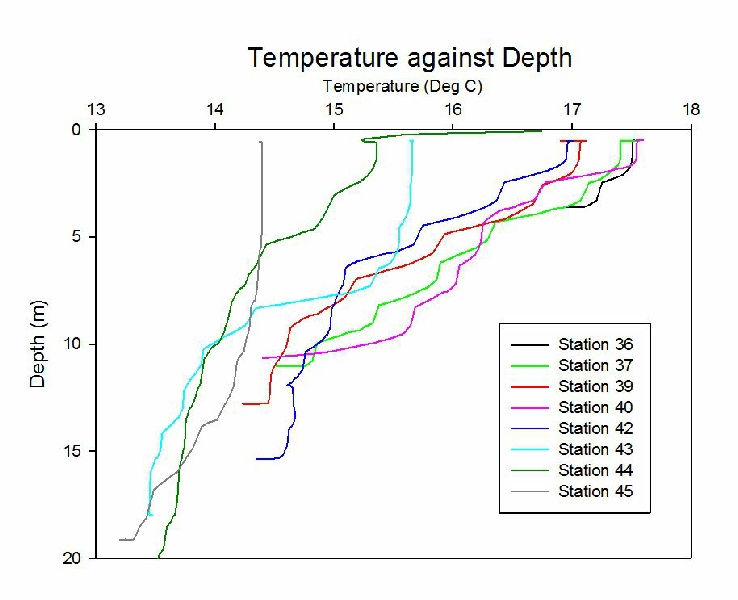
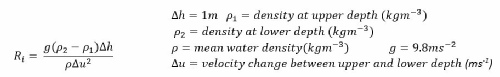
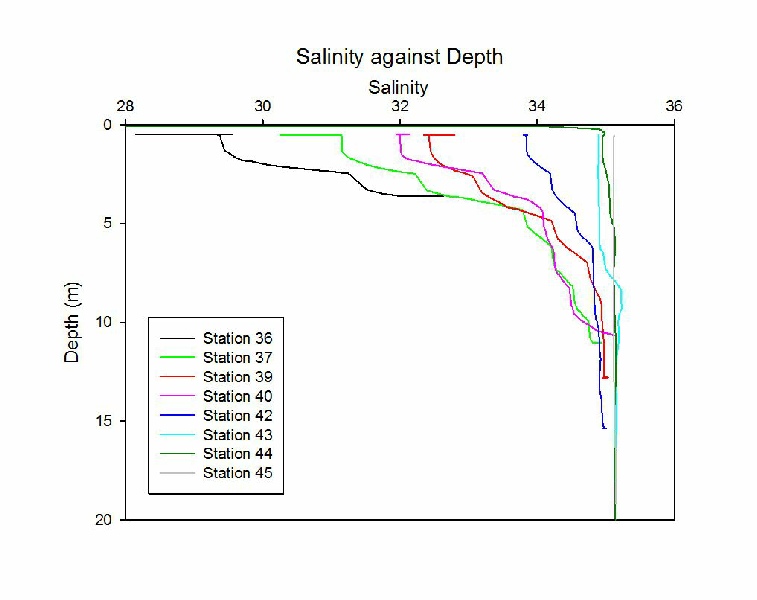
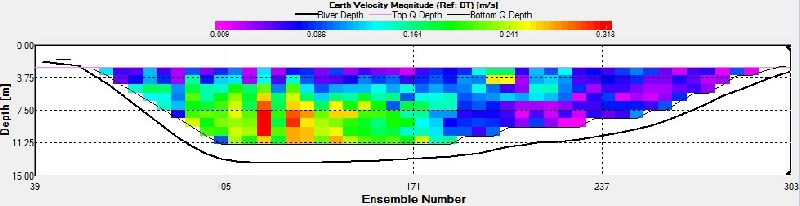
Figure 6: Velocity Cross section at station 37/38
Station 37/38: This ADCP transect shows that there was a maximum depth of 10.9m at station 37/38. The maximum flow velocity along this transect is 0.318m/s which occurs between 7.50m and 11m on the eastern bank of the estuary (the left hand side of the transect). This area of high flow velocity is most likely down to the location of the transect as it is located just south of the confluence of the Truro River and the River Fal. The faster flowing River Fal conjoins the Truro River from the east explaining the faster flow velocity on this bank of the channel. The above average flow velocities in the centre of the channel is due to the tide which was flooding into the estuary at this time.
Figure 7: Velocity Cross section at station 39
Figure 8: Velocity Cross section at station 40/41
Station 39: The maximum depth at this station was 14.86m with the highest velocity of the flow at 0.331 m/s occurring in the middle of the channel between depths of approximately 6m and 11m. On either side of the greatest flow at the peripheries of the channel, the velocity of the flow is at its lowest value at the estuary bed of approximately 0.055 m/s. The velocity on the Eastern side of the channel (left hand side of the transect image) at approximately 4.5m depth is 0.270, slightly higher than the surface values of 0.120 to 0.200 m/s. This increase may be due to a shallower depth causing the water to flow through a smaller area, resulting in an increase in velocity here. The high velocity in the centre of the channel is mainly a result of the tide which at 09:36 UTC was flooding into the estuary.
Station 40/41: The maximum depth at this station was 13.87m with the middle of the channel experiencing the greatest flow velocity of 0.343m/s. This station is located on relatively straight part of the channel meaning the tide, flooding into the estuary, has the greatest influence on the flow velocity. This area of high flow velocity occurs throughout the water column at depths of 4.5m to 13m. The Eastern side of the channel has flow velocities of approximately 0.151m/s which is greater than the surface velocities in this area of the channel, which are approximately 0.05m/s. This can be explained by water being forced through a channel of a smaller area leading to an increase in velocity.
Figure 9: Velocity Cross section at station 42
Figure 10: Velocity Cross section at station 43
Station 42: This ADCP transect shows a maximum depth of 14.86m where the flow velocity approximately 0.058m/s. This is located on the Western bank of the channel (the right hand side of the transect). On this side of the channel there is a confluence of two water bodies which leads a variety of flow velocities as mixing occurs. This is shown in this area with a range of velocities from 0.019m/s to 0.319m/s. The lower range of these velocities occurs on the estuary bed which is explained by friction. The centre of the channel experiences the greatest flow velocities, peaking at 0.32m/s. This transect was taken at 11.38 UTC meaning the flood tide has strong influence in the centre of the channel. The Eastern channel is sheltered by a headland so the tidal influence in this side of the channel decreases. As expected, lower flow velocities occur ranging from 0.003m/s to 0.188m/s.
Station 43: This ADCP transect shows that in the deep channel, with a maximum depth of 22.78m, there is a maximum flow velocity of 0.191m/s. This area of high velocity occurs at depths between 5m and 13m. This transect was taken at 12.15 UTC where there was a tidal flood into the estuary which is the strongest influence on flow velocity. On both sides of the channel where the depth of the channel has a maximum of 4.96m on the Eastward side (left on the transect) and 3.97m on the Westward side (right on the transect) there is a range of velocities from 0.045m/s to 0.191m/s. This large range of velocities is due to the small area in which the flow if forced through. The banks of the deep channel in the centre of the channel show area of low flow velocity which can be explained by a large amount of friction.
Figure 11: Velocity Cross section at station 44
Figure 12: Velocity Cross section at station 45
Station 44: The width of the channel has increased at the station four transect from Trefusis Point to the East bank as the Fal and Turo rivers have fed into the main estuary. The maximum depth here is 21.79 meters in the centre of the channel. The maximum velocities occur on the West side of the channel (right on the transect plot) reaching values of 0.142 m/s. The transect was started at 13:03 UTC which is approximately half an hour before high tide; this suggests there isn’t much variation in velocity due to the tide. The google earth image of the stations shows that the Mylor creek inlet is just above the start point of the transect, with this in mind the heightened flow at this point on the western side of the channel may be due to inputs from this source. Furthermore, the maximum velocity appears to run off the shallower part of the bed, of approximately 7m depth, on the Western side of the channel and the higher velocity extends into the channel providing evidence for this. The remaining velocity of the water column is on average 0.059 potentially indicating that there is lesser tidal influence at this station.
Station 45: The maximum depth of the water column at this station is 34.66 m. The transect was started at 13:55 UTC which corresponds to a slack tide therefore, like at station 44, the tidal influence on the velocity at this station is low. The increased velocity on the Western side of the channel is the highest velocity in the transect, corresponding to 0.185 m/s. The velocity may be increased here due to the shallow depth of approximately 9.91m forcing the water through a reduced area and the influence of water flow out of Falmouth harbour and the Penryn River.
Looking at the ADCP transects for stations 44 and 45 the backscatter data does not extend to the maximum depth of the water column as indicated by the solid black line. This is due to incorrect configuration of the ADCP software on set up or a potential calibration drift of the instrument over the course of the day.
Figure 13-
Figure 4: Temperature Profiles (Click to enlarge)
The flushing time of an estuary is the time needed to replace the freshwater fraction of the estuary. It is a term generally used when investigating the effects of pollutants in the estuarine system as it can give you an idea of how long a specific substance will likely stay in the estuary for. It can be calculated in a number of ways; here the tidal prism method is used.
Equation used to calculate flushing time:
Ve = Volume of water in estuary (m3)
Vp = Volume of tidal prism (m3) = Area of estuary (m2) x Tidal range (m)
Tp = Tidal period
During sampling on 27/06/2015 by Group 1 and Group 13, a total of 8 ADCP cross-
The calculated flushing time was 90.8 hours, which
can be considered quite slow, but corresponds to the meso-
Disclaimer: The views expressed here are not associated with those of the National Oceanography Centre Southampton or the University of Southampton.
Station 36-
Station 37/38-
Station 39-
Station 40/41-
Station 42-
Station 43-
Station 44-
Station 45-
From the portion of the estuary that was surveyed we can conclude that the riverine
end of the estuary demonstrates a salt wedge and the marine end of the estuary displays
a well-
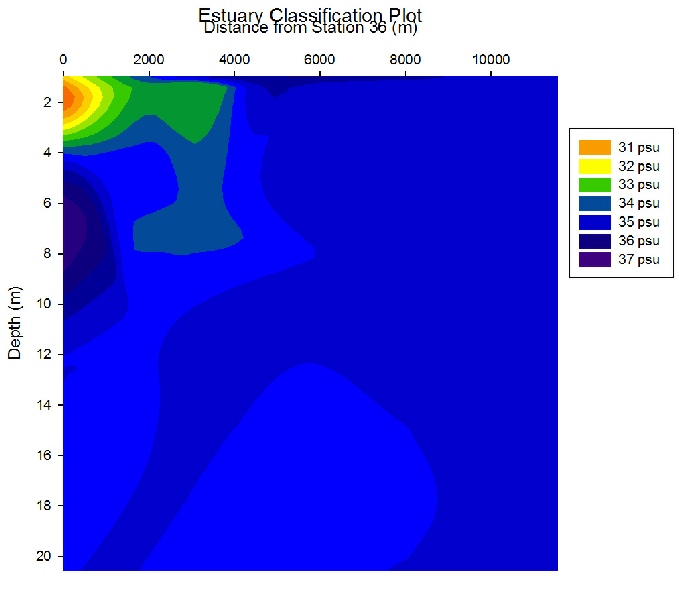
Figure 21: Estuary Classification by salinity (Click to enlarge)
Figure 3: Salinity Profiles (Click to enlarge)