Falmouth 2015 -
Phytoplankton
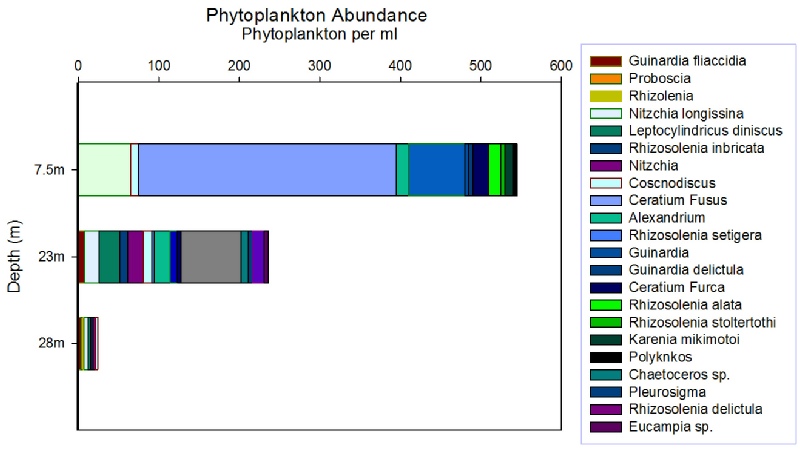
Due to human error we collected phytoplankton data for only one of our 3 sampling stations, station 4.
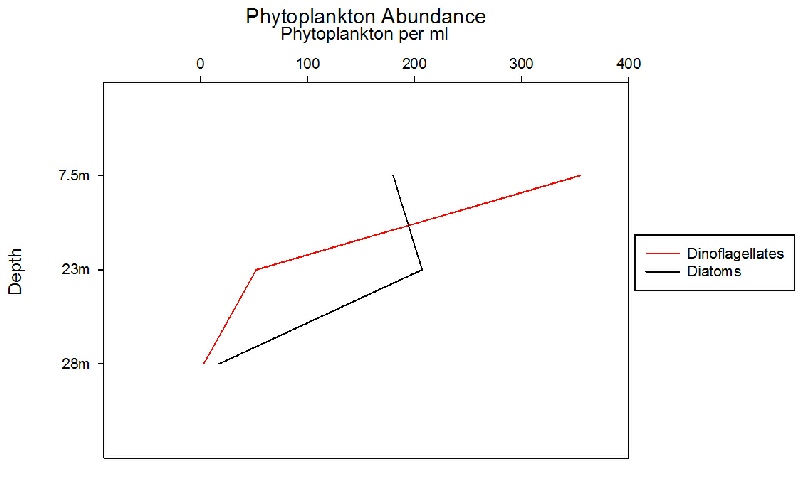
At this station 22 different species were observed. The Ratio with depth of phytoplankton abundance (7.5m, 23m, 28m) is 33:16:1. Figure 22 shows the relative abundance of dinoflagellates and diatoms overall 32% of phytoplankton were Dinoflagellates and 68% were Diatoms. However the single most abundant phytoplankton was Ceratium fusus a dinoflagellate, which dominated in surface waters (7.5m). At this depth the largest number of phytoplankton were counted 535 per ml and the species Rhizosolenia alata, Rhizsolenia stoltertothi, Polyknkos and Guinardia delectula were only found at this depth. At this depth 66% of phytoplankton were dinoflagellates and 34% were diatoms. The most bio diverse depth was 23m, where 15 different species were observed. The most abundant species was Karenina mikimotoi with 75 per ml. The species Rhizosolenia delectula, Pleurosigma, Eucampia sp and Chaetoceros sp were only found at this depth. At this depth 20% were dinoflagellates and 80% were diatoms. 28m had the lowest phytoplankton abundance of 20 per ml. The species Proboscia was only found at this depth and 15% of phytoplankton were dinoflagellates and 85% were diatoms.
Both chlorophyll and oxygen data showed a peak in values at 23m, 2.8 umol/L and 274.3 umol/L respectivley. At 28m there is a drop in oxygen, to 256.8 umol/L and chlorophyll to 0.5 umol/L levels. This correlates to the high abundance of phytoplankton at 23m and the low abundance at 28m.
The chlorophyll maxima at 23m does not correlate with our phytoplankton abundance data. This discrepancy may be a consequence of measuring phytoplankton number and not biomass as chlorophyll concentration is an indicator of biomass. Another factor may be the high presence of the mixotroph Ceratium fusus. This phytoplankton photosynthesises as well as using phagocytosis (Sahfos, 2010), therefore it would contain less photosynthetic cells than an autotrophic phytoplankton.
Between 23m and 28m there is a four fold increase in silicon from 1.0 umol/L to 4.3
umol/L. This relates to an increase with depth of the diatom to dinoflagellate ratio.
Diatoms uptake silicon for use in their tests and therefore thrive is silicon rich
environments(Martin-
References:
Martin-
Sahfos.ac.uk,. ‘Ceratium Fusus’. N.p., 2010. Web. 25 June 2015.
Zooplankton data was collected for all 3 of the sampling stations, stations 1,2 and
4. 13 species were identified, of which Copepoda, hydromedusae, Cladocera, Polychaeta
larvae, Chaetognatha and Appendicularia were found at all stations. Over all 3 stations
Copepoda were the most abundant with 2366 per m3, the total number of zooplankton
was 8913 per m3. Station 1’s net sample was taken from 35-
Due to our lack of phytoplankton data were unable to accurately compare it with the zooplankton data. We would expect large abundances of phytoplankton to cause large abundances of zooplankton if we had the data for stations 1 and 2.
However, when looking at the fluorescence and chlorophyll data for stations 1 and 2 we can see that station 1 had the highest maximum fluorescence value and station 2 had the highest maximum chlorophyll
concentration. This correlates to our zooplankton abundance data as stations 1 and 2 had higher abundances than
station 4.
Station 4 had a well mixed water column and therefore a lower phytoplankton abundance was expected whereas stations 1 and 2 both had seasonal thermoclines which suggests a greater phytoplankton and therefore zooplankton abundance.
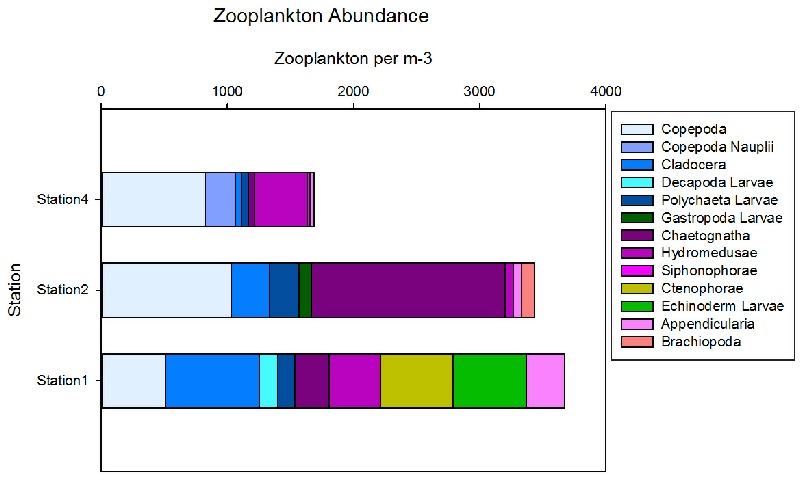
Figure 21: Phytoplankton Abundance(Click to Enlarge)
Figure 22: Phytoplankton against Zooplankton Abundance (Click to Enlarge)
Figure 23: Zooplankton Abundance (Click to Enlarge)
Disclaimer: The views expressed here are not associated with those of the National Oceanography Centre Southampton or the University of Southampton.