
Falmouth 2015 -
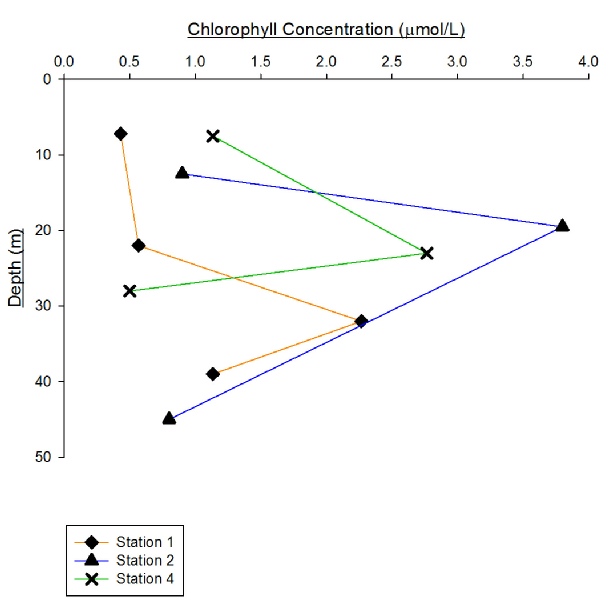
Figure 19: Chlorophyll Concentration against depth (Click to Enlarge)
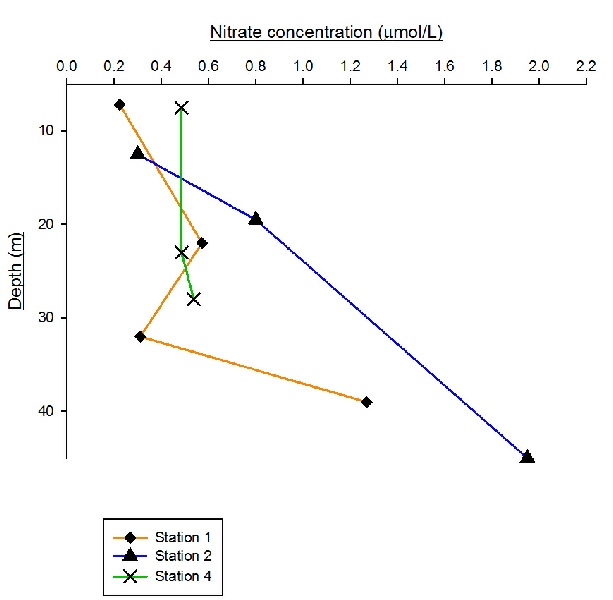
Figure 16: Nitrate Concentration against depth (Click to Enlarge)
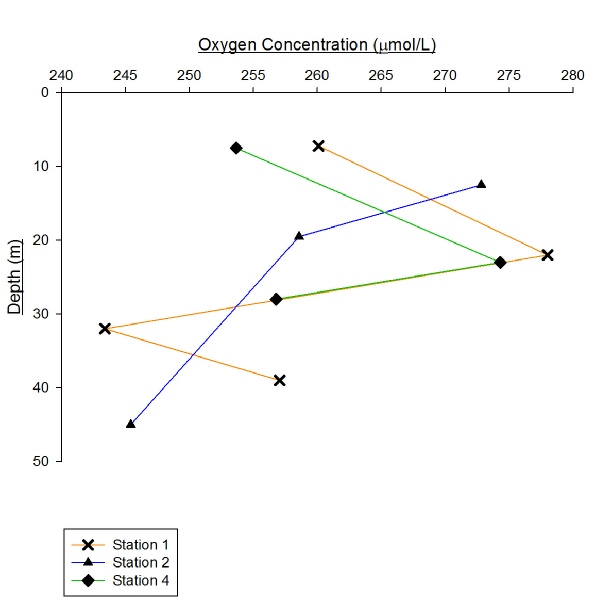
Figure 20: Oxygen Concentration against depth (Click to Enlarge)
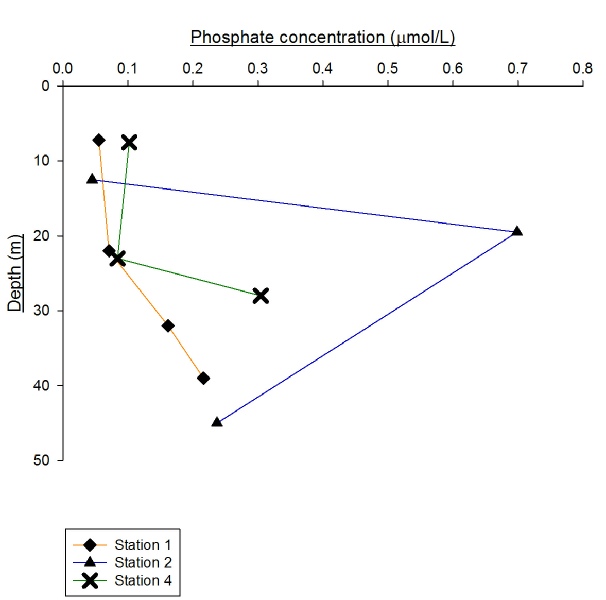
Figure 18: Phosphate Concentration against depth (Click to Enlarge)
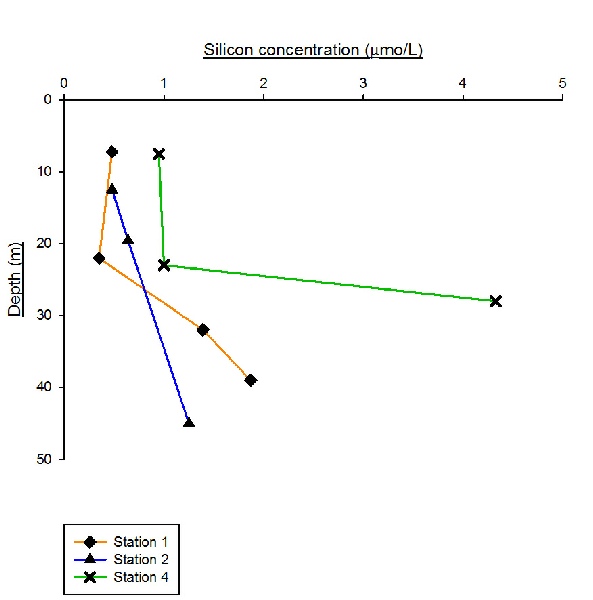
Figure 17: Silicon Concentration against depth (Click to Enlarge)
Each station shows lowest nitrate concentration levels at the surface, with station one reaching a minimum concentration of 0.2µmols per litre; this could indicate nitrate uptake by plankton in this region and/or a reduction in nitrate run off due a prior period of dry weather. Concentration increases with depth fairly rapidly for station two which appears to relate to the position of the thermocline, whereas concentration levels at station four remain constant and only begin to increase below 23 meters depth. Station one exhibits a concentration increase of nitrate to 0.57µmols per litre at 22 meters and then experiences a return decline to similar levels as seen at the surface at 32 meters. Following this the concentration increases with depth at a high rate to 1.27µmols per litre, overall indicating the presence of a double thermocline at this station.
Silicon concentration across all three stations shows an increase with depth below
20 meters which could reflect the remineralisation of silicon with depth; however
at station one between 7.2-
Station one concentrations increased slightly above 22 meters followed by an escalation in concentration from 0.16µmols per litre at 32 meters to 0.2µmols per litre at 39 meters depth; which could again suggest remineralisation in this area. Station two shows a rapid increase in phosphate concentration in the first 19.5 meters to 0.7 µmols per litre, with an equally rapid decline in concentration to 0.25µmols per litre at 45 meters. The decrease may be due to uptake by zooplankton below the thermocline, however the frequency of data prevents a valid conclusion being drawn. Station four showed an opposing trend to station two with an initial concentration decrease from 0.10 µmols per litre to 0.09 µmols per litre, followed by a concentration increase; however it is realistic to consider that this occured over a smaller scale with low variation between the concentrations. Station four may support the proposed uptake above the thermocline and remineralisation below the thermocline of phosphate.
Stations two and four follow a similar trend with concentrations of chlorophyll increasing
from the shallowest values down to 19.5 meters for station two, and 23 meters for
station four. Using chlorophyll as a proxy for phytoplankton abundance, all station
data implies the organisms increase in number from the surface to thermocline and
subsequently decrease below the thermocline, as indicated by the decrease in chlorophyll
concentration. At station one there is an overall increase in concentration levels,
however from 22 meters depth there is a steeper increase in concentration from 0.56
µmols/L to 2.26 µmols/L at 32 meters, before decreasing to its final concentration
of 1.13µmols/L at 39 meters. Station one displays a two-
Stations one and four show very close covariation in initial increase and subsequent
decrease in concentration to a depth of 28 meters. The initial increase in oxygen
concentration could be resulting from phytoplankton in the surface layers releasing
oxygen through photosynthesis to the surrounding environment. At station one, concentrations
continue to decline to 243.39 µmols per litre at 32 meters. The decrease in oxygen
concentration could be attributed to an overall reduction in dissolved oxygen with
depth and the requirement for organisms to increase their uptake to support metabolic
functions. Station one then displays a second concentration increase to 257.065µmols
per litre at 39 meters; this potentially indicates the base of the two-
The initial findings outlined above are speculated solely from the data obtained
working offshore. In many cases there is not sufficient evidence to draw up valid
reasons for apparent trends and analysing very small concentration changes may not
be evident of a trend but simply a minor variation as the water column is mixed via
diffusion and larger-
Disclaimer: The views expressed here are not associated with those of the National Oceanography Centre Southampton or the University of Southampton.