Offshore: Chemical
Falmouth, 2014
Due to calm waters and fair weather, a time series was constructed from RV Callista to compare levels of nutrients, oxygen saturation and chlorophyll throughout the water column ranging in temperature and salinity. RV Callista was positioned approximately 9 miles from Falmouth where the water flow would be relatively independent of coastal riverine output. The water body here was highly stratified with a strong thermocline.
Note: all time is measured in UTC
Figure 1 shows greater oxygen saturation observed in surface waters earlier in the day, such as 08:30 UTC and 10:30 UTC which exhibited oxygen saturation between 105 and 110 %, whereas the 16:30 UTC sample was undersaturated in oxygen. This difference could be due to greater phytoplankton productivity occurring earlier in the day, as supported by Harding et al (1981).
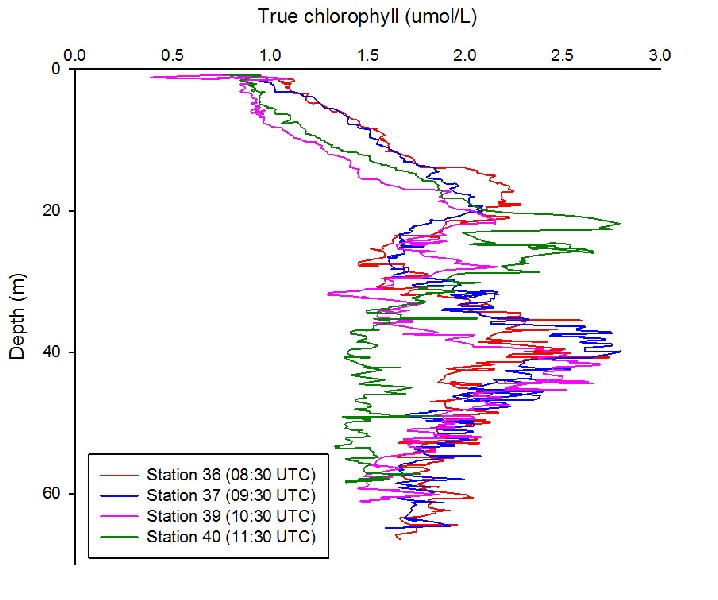
Oxygen saturation maximum occurred around 25 m throughout the day, coinciding with the chlorophyll maxima observed on the CTD data (figure 5). After this point oxygen saturation decreased with depth at all times sampled, which could be due to heterotrophic respiration below the thermocline.
Most stations exhibited nitrate minima around the chlorophyll maxima, at approximately
25 m depth (figure 2), which could be due to uptake by phytoplankton. At approximately
09:00 the ADCP data demonstrated tidal-
Generally the morning stations had low surface silicon concentrations (figure 3). From 08:30 till 10:30 the concentrations measured ranged between 0 and 1 μmol/L, which could also be explained by the increased morning phytoplankton activity. Samples from 13:30 demonstrated much greater surface silicon concentrations. However the samples taken at 15:30 did not follow this trend, possibly due to sustained rainfall during this period diluting surface silicon concentration.
The phosphate surface concentrations measured in the afternoon were significantly
greater than those in the morning, for example sampling at 15:30 gave a surface phosphate
concentration of around 0.58 µmol/L, compared to the 0-
Double chlorophyll maxima were observed from 08:30 until 10:30, occurring at approximately 20 and 45 m; with the 45 m sample appearing more pronounced. At 11:30 there was only a single chlorophyll maximum around 25 m depth, shown again at 13:30. However at 14:30 chlorophyll concentration appeared to be vertically homogenous.
References
Fernand L., Weton, K., Morris, T., Greenwood, N., Brown, J., Jickells, T., 2013,
‘The contribution of the deep chlorophyll maximum to primary production in a seasonally
stratified sea, the North Sea’, Biogeochemistry, 113(1-
Harding Jr L.W., Meeson B.W.; Prezelin B. B.; Sweeny B.M., 1981, ‘Diel periodicity
of photosynthesis in marine phytoplankton’, Marine Biology, 61(2-
Pingree, R.D., Maddock, L., Butler, E.I., 1977, ‘The influence of biological activity
and physical stability in determining the chemical distributions of inorganic phosphate,
silicate and nitrate’, Journal of the Marine Biological Association of the United
Kingdom, 57(4), pp. 1065-
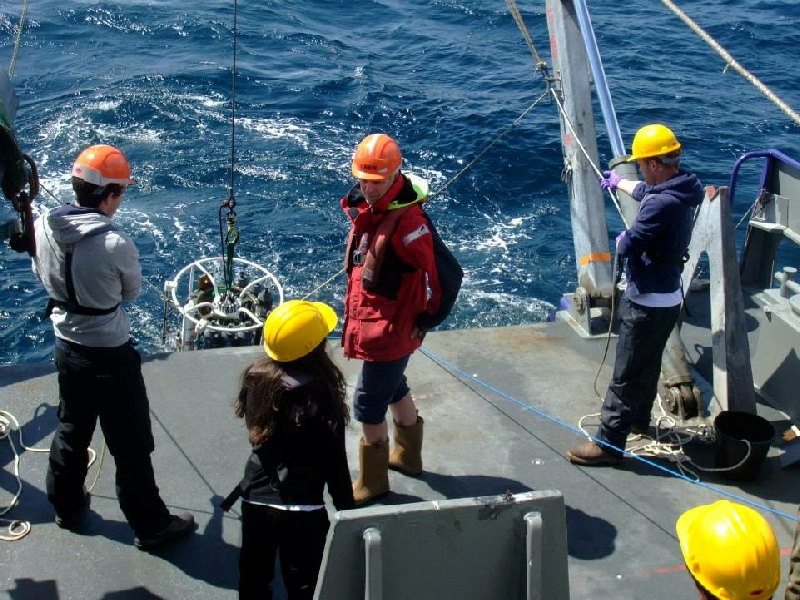
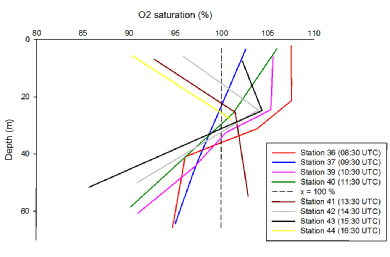
Figure 1: Oxygen saturation depth profiles taken at hourly intervals from 08:30. Click to enlarge.
Figure 3: Silicon concentration depth profiles taken at hourly intervals from 08:30. Click to enlarge.
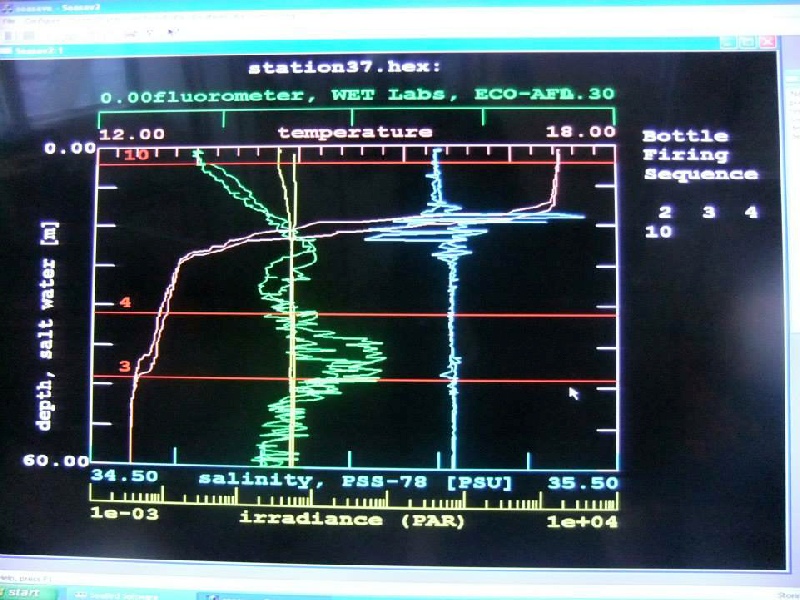
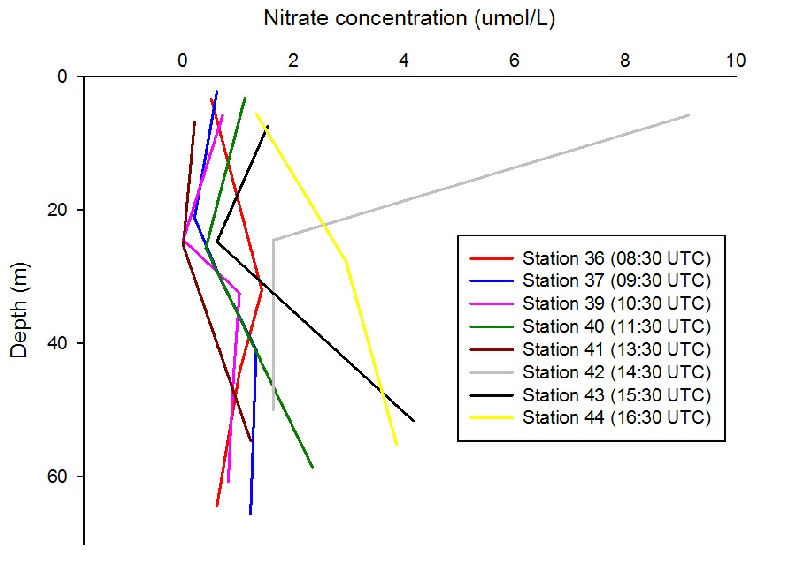
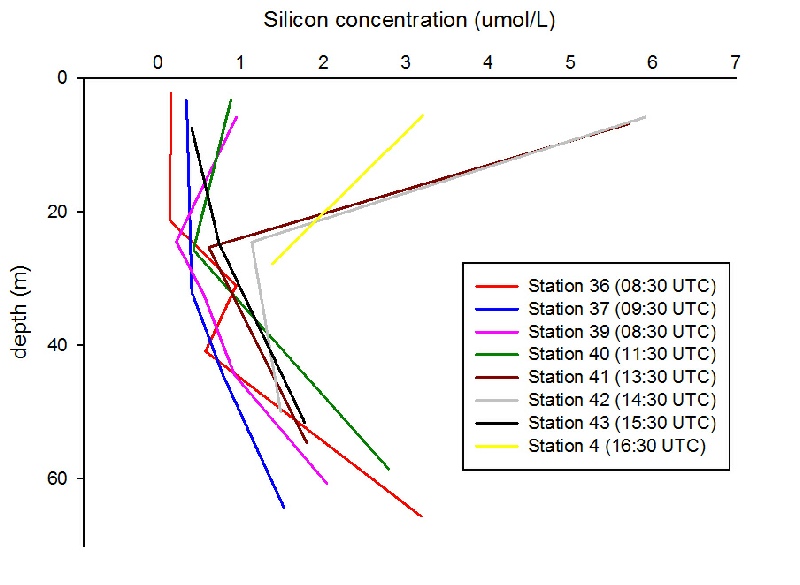
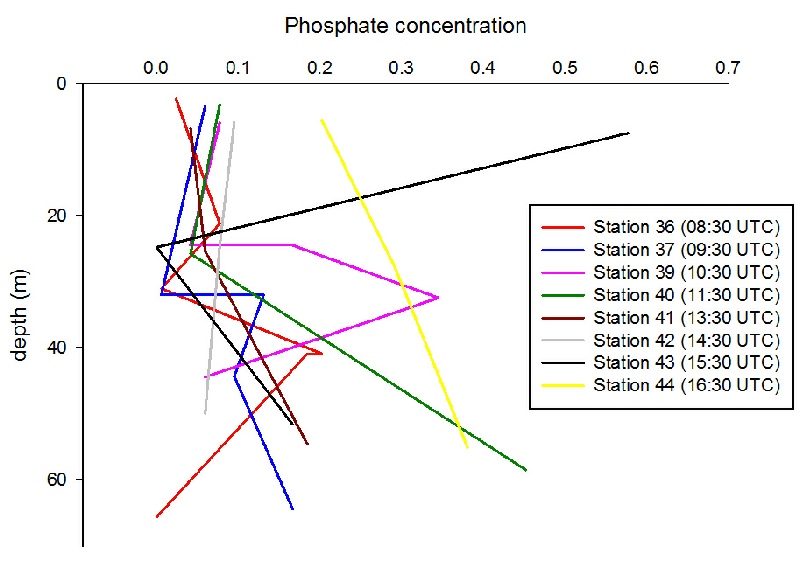
Figure 4: Phosphate concentration depth profiles taken at hourly intervals from 08:30. Click to enlarge.
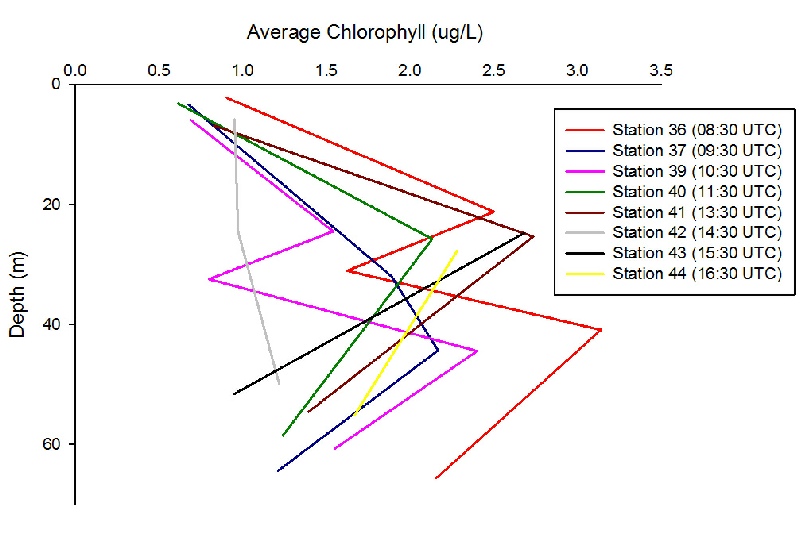
Figure 5: Chlorophyll concentration depth profiles taken at hourly intervals from
08:30, (a) measured from a CTD-
Figure 2: Nitrate concentration depth profiles taken at hourly intervals from 08:30. Click to enlarge.
a
b
This page looks at: