Estuarine: Physical
Falmouth, 2014
The temperature (°C) was measured at the Pontoon using a CTD each half hour, in order to determine the variability of this parameter. Figure 1 shows the fluctuation of the temperature at different depths over time. The temperature values decrease with time and depth, with a maximum temperature at the surface of 19.4°C (12:30) and minimum of 17 °C at 5 meters (15:00). The increase in temperature and sunlight contributed to the high values at the surface, and there was a gradual variation during the day with depth. There was no change in the weather conditions during the day, so the results were influenced only by the tides. It is possible to notice the formation of a thermocline in the afternoon, due the high water influence.
At the pontoon, the salinity was also measured using a CTD each half hour.. The measurements started in the morning on the ebb tide, which explains the lower salinity values along the depth during this period (Figure 2).The salinity is increasing over time due the inflow of seawater at this point. The highest value was 35.1 and which occurred in the afternoon between 13:30 and 15:00 UTC, at depths around 3.5m to 5m during flood tide. With the decrease of the temperature and increase of the salinity, the density of the water mass became higher and it sank to the bottom.
A current meter was utilised to measure the velocity (m/s) and direction (degrees) of the flow (Figure 3). The highest velocity was 0.32 m/s and occurred at depths between 0.5m and 1m around 13:30 UTC. Assuming that the Fal Estuary is positioned from North to South, with the mouth of the estuary to South, we considered current speed positive when flowing from South to North and negative when the opposite occurs. It’s possible to see high positive values in the flood of the tide and an increase in negative values in the ebb tide. It is possible to see that saline water flows mainly close to the seabed, while the less saline water starts flowing towards the sea ,mainly in the surface.
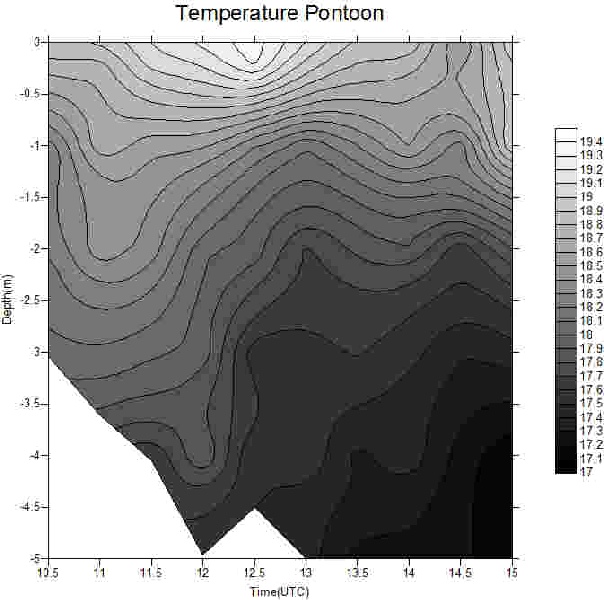
Figure 1: Temperature along depth at the Pontoon
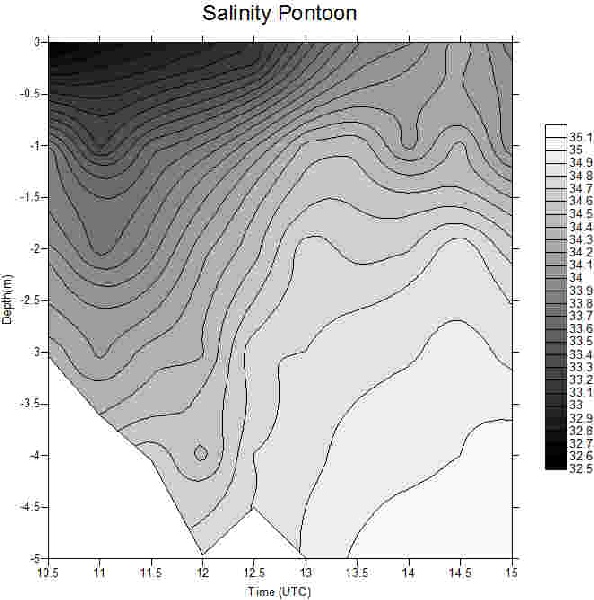
Figure 2: Salinity along depth at the Pontoon
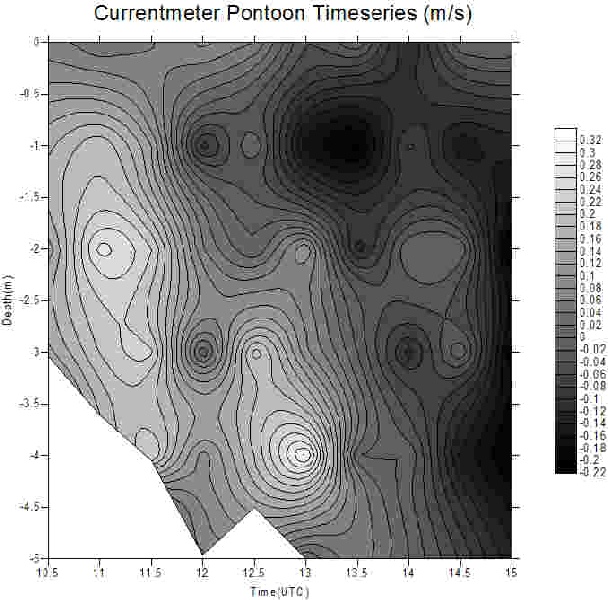
Figure 3: Current meter at the Pontoon Time series
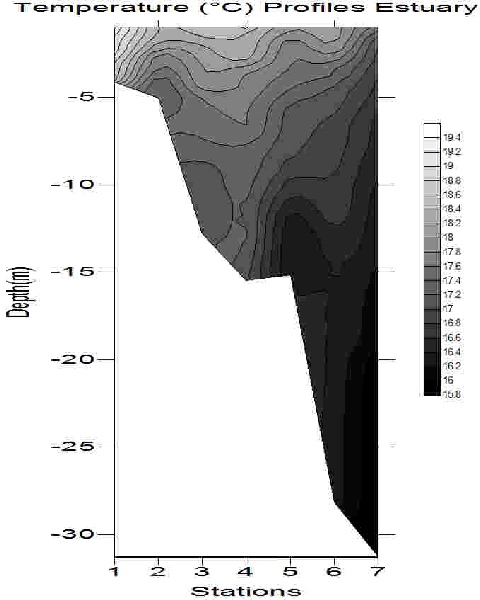
The temperature values (Figure 4) increased up the estuary (Station 1), with the highest value of 19.4°C at the surface. This occurred due to warming by the sun, which has a greater influence in shallow waters. A thermocline is not present with small gradient of temperature. The water column was well mixed along the estuary with no contrasting gradient. The cold temperatures in the bottom of water mass on station 7 occur due the inflow of oceanic waters.
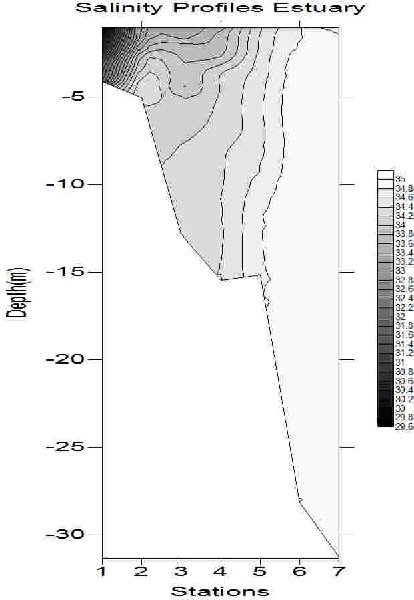
Due to the riverine inputs at Station 1, the salinity (Figure 5) was 29.6 at the surface; the lowest value measured along the estuary. From the Station 2 to Station 5 there was no significant gradient with the increase of the depth. In the last two stations, station 6 and station 7, the salinity remained at a constant value of 32, showing a well mixed portion of the estuary with no stratification.
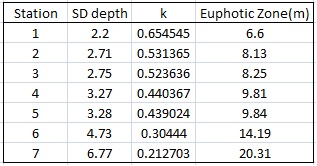
A Secchi disk was used to measure the water transparency at all of the stations throughout the Fal estuary (Table 1). Stations 1, 2 and 3 presented low values indicating low transparency and high turbidity. Possible causes for the low values of Secchi disk depth include, increased suspended material and algae abundance. From Station 4 towards the mouth of the estuary, the influence of the ocean was more expressive and the attenuation of the light was smaller, thus increasing the values, which represent higher transparency and lower turbidity. The euphotic zone was calculated using Secchi Disk depth, it is important to remember that this method is inaccurate and represents only an estimation of the euphotic zone.
Figure 4: Temperature Profiles along the Estuary
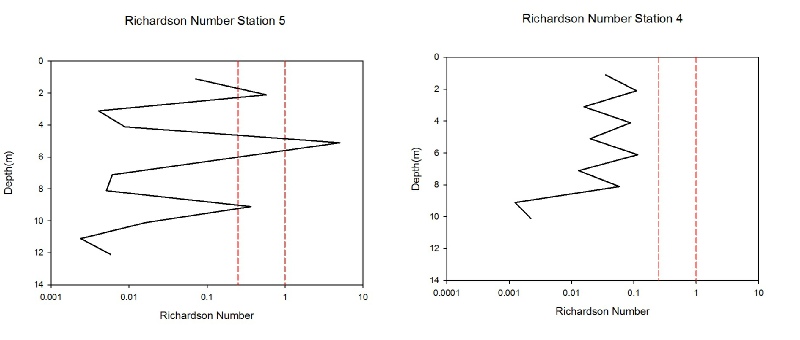
The Richardson number, a dimensionless number utilised to indicate the flow stability, was calculated for all stations throughout the estuary. Most of the stations (1,3,4, 6 and 7)showed a Richardson number lower than 0.25, thus representing a turbulent flow along the depth. The stations 2 and 5 showed values of Richardson number higher than 1 in given depths (around 3 meters at station 2 and 5 meters at station 5), which represent a laminar flow (Figure 6). This difference can be caused by an intrusion of a different water mass in the station, which will have different physical properties, and therefore a distinct current shear.
Table 1: Values of Secchi Disk, k, and Euphotic Zone.
Figure 5 Temperature Profiles along the Estuary
This page looks at the: