Estuarine: Chemical
The Fal estuary receives a high volume of freshwater input due to relatively intense rainfall and an impermeable underlying bedrock in the surrounding area. Alongside the intense farming in the surrounding area this results in high nutrient concentrations throughout the estuary, with hypernutrification being a regular occurrence (Langston et al., 2003). Investigating how key chemical concentrations change along an estuarine gradient and with depth allows the chemical behaviour to be analysed, which has significant implications for the local biota.
Surface chlorophyll remained low (below 0.1 μg/L) from 10:30 to 13:00, then began
to increase around high tide, 14:21 UST. This could have been due to the lack of
flushing associated with slack tide, causing a more stable water column and resulting
in phytoplankton biomass remaining high in surface waters (e.g. Lauria et al., 1999).
The extreme high chlorophyll concentration of 5.88 μg/L recorded at 15:00 UST could
be an anomalous result caused by sampling an aggregation of mucus-
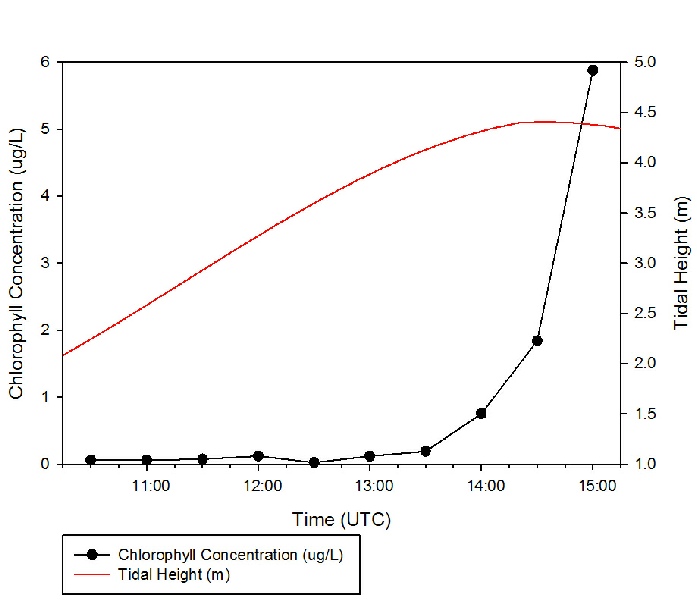
Figure 1: Chlorophyll concentration against time with tidal curve shown. Click on figure to enlarge.
Estuarine Mixing Diagrams
The strong correlation observed between silicate and salinity showed that it was behaving conservatively, i.e. not being removed or added in the estuary. However phosphate and nitrate concentrations varied more more with increasing salinity, possibly being removed at the head of the estuary and added at the mouth. This is due to phosphate and nitrate’s integral role as macronutrients and are therefore taken up by all phytoplankton, whereas silicate is only used by a few families. This was corroborated by the decrease in chlorophyll down the estuary, suggesting that it was low nutrient concentrations limiting the growth of phytoplankton rather than low light levels.
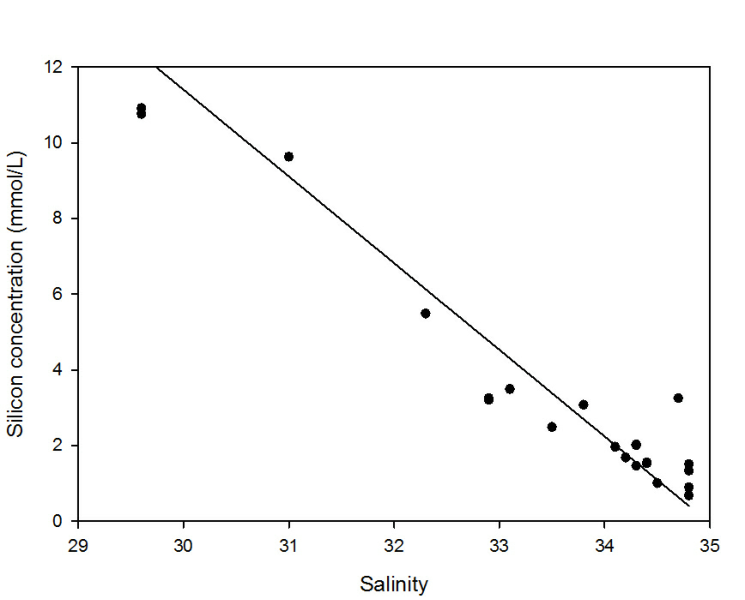
Silicate decreased proportionally with increasing salinity, with an initial riverine
concentration of 63.83 decreasing to 0.67 at the highest salinity of 34.8. The proximity
of all the points to the Theoretical Dilution Line in the zoom gave an r2 value of
0.9375 indicating that silicate was conservative. However we do not know what was
occurring in the intermediate salinities. Silicate usually behaves semi-
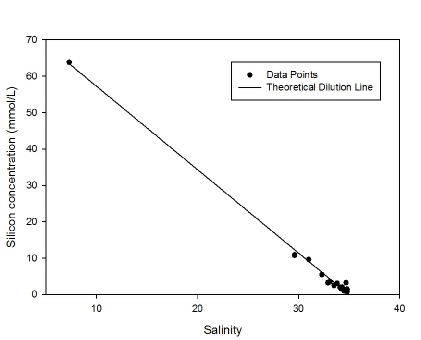
Figure 2: Silicon estuarine mixing diagram. Click on the higher salinities for greater resolution.
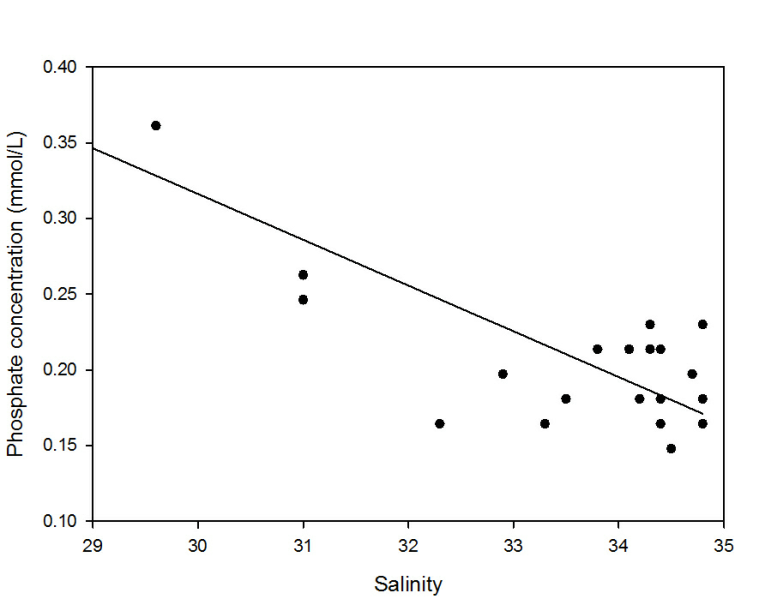
Phosphate also decreased with increasing salinity, from 1.0 µmol/L at the riverine
end member to 0.14 µmol/L at a salinity of 34.8. Whilst the points appear close to
the TDL, when viewed in greater resolution there appeared to be significant variation
from the TDL. Prior to a salinity of 33.5 the phosphate levels were lower than those
predicted by the TDL, which suggests that it is being removed. This non-
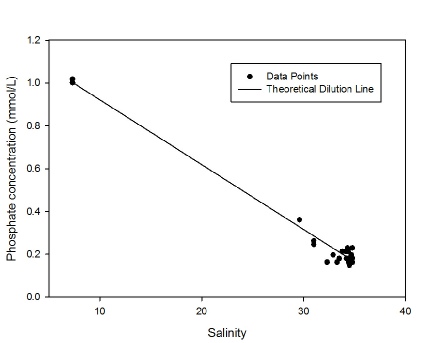
Figure 3: Phosphate estuarine mixing diagram. Click on the higher salinities for greater resolution.
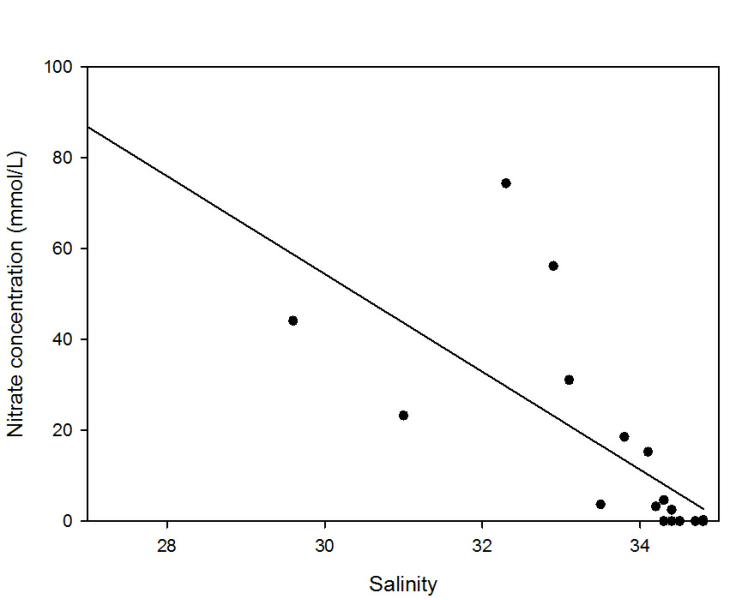
Nitrate also decreased approximately linearly with the increasing salinity. Apparent
addition of nitrate often occurred between salinities of 32 and 34, possibly due
to nitrate pollution from industrial waste water such as Newham STW as observed by
Langston et al., 2003. However below salinities of 32 nitrate concentration was lower
than predicted, and there is also a notable presence of 0 nitrate concentrations
at salinities higher than 34. One cause for this could be increased phytoplankton
production, however chlorophyll has not increased in a bloom-
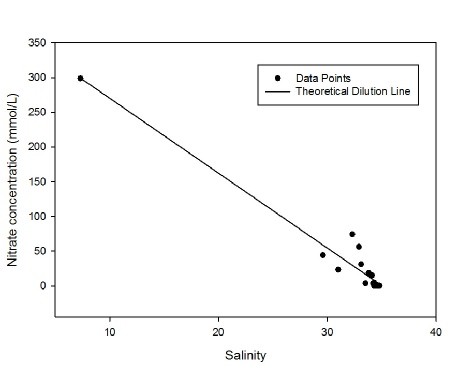
Figure 3: Nitrate estuarine mixing diagram. Click on the higher salinities for greater resolution.

Estuarine Mixing Diagrams
Figures 4-
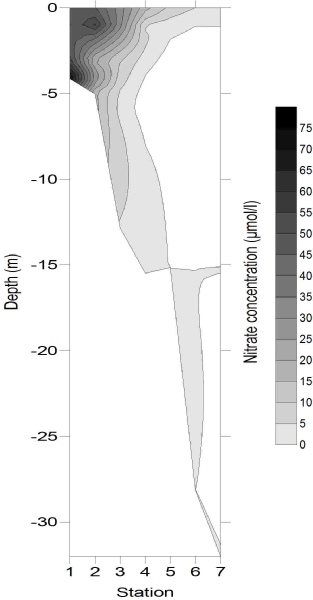
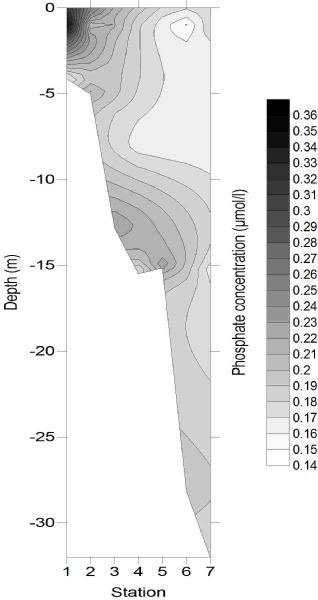
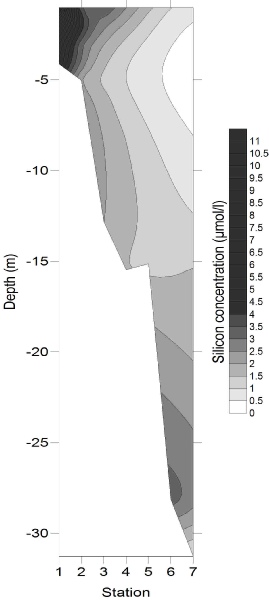
Figure 4-
4
5
6
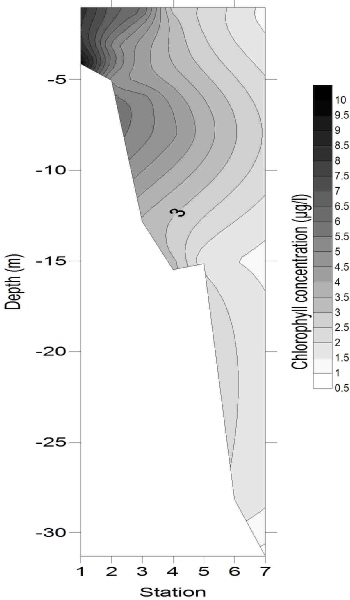
Chlorophyll concentration (Fig. 7) followed the same pattern as the major nutrients horizontally, with concentrations of 9.83 μg/L at 4 m deep at station 1, and decreasing to 0.81µg/l by the deepest sample from station 7. This is likely to be due to the high nutrient concentrations stimulating some phytoplankton growth, but not to the extent that nutrients were depleted. Whilst chlorophyll concentrations were generally greatest in the surface samples, a maximum also occurred at around 7 m depth, with concentrations reaching 4 – 6 μg/L at stations 3 and 4, which could be evidence for enhanced phytoplankton growth occurring around the thermocline (hyperlink to CTD temperature data). The relative homogeneity in chlorophyll concentration at stations 6 and 7 implied that light was not limiting phytoplankton growth.
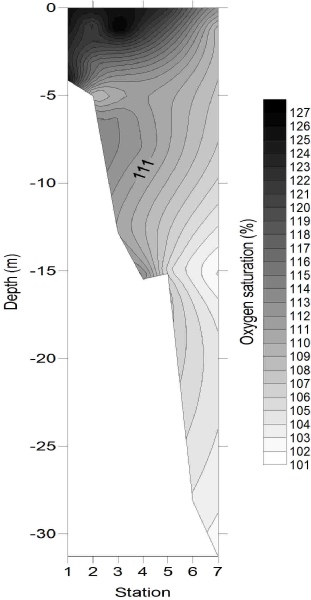
Oxygen (Fig. 8) exhibited greatest concentrations within the surface samples of stations
1 and 3 with saturations of 125.4% and 128.0% respectively. One explanation for this
could be the increased productivity associated with the riverine end, as demonstrated
by higher chlorophyll concentrations. Oxygen appeared to be the most vertically heterogeneous
of the chemicals measured, for example station 7 which had a saturation difference
between surface and depth samples of 6%. This could be due to enhanced heterotrophic
respiration and remineralisation in the deeper waters resulting in increased oxygen
depletion. The lowest concentrations, 101 -
The close-
Note that a maximum of three samples were taken at each depth due to time and equipment limitations, which means that caution must be taken when drawing any conclusions about the vertical profiles.
Falmouth, 2014
Figure 7: Chorophyll depth profile, obtained using (a) Niskin bottle samples, and
(b) a CTD-
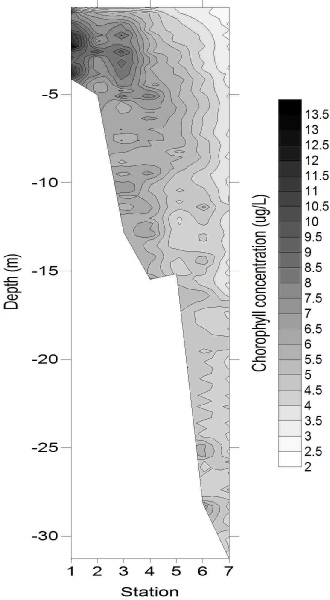
Figure 8: Oxygen saturation depth profile.
References
Grasshoff K.; Kremling K.; Ehrhardt M., 1999, Methods of seawater analysis. 3rd edition.
Wiley-
Johnson K.; Petty R.L., 1983, Determination of nitrate and nitrite in seawater by
flow injection analysis, Limnology and Oceanography, 28, 1260-
Kiorboe T.; Hansen J.L.S., 1993, Phytoplankton aggregate formation – observations
of patterns and mechanisms of cell sticking and the significance of exopolymeric
material, Journal of Plankton Research, 15(9), 993-
Langston W.J.; Chesman B.S.; Burt G.R.; Hawkins S.J.; Readman J.; Worsfold P., 2003,
Characterisation of the European Marine Sites in South West England: the Fal and
Helford candidate Special Area of Conservation (cSAC), Marine Biodiversity, 186,
321-
Lauria M.L.; Purdie D.A.; Sharples J., 1999, Contrasting phytoplankton distribtutions
controlled by tidal turbulence in an estuary, Journal of Marine Systems, 21(1-
Parsons T.R.; Maita Y.; Lalli C., 1984) A manual of chemical and biological methods for seawater analysis” , Pergamon p.173.
Ryther J.H.; Dunstan W.M., 1971, Nitrogen, phosphorous and eutrophication in the
coastal marine environment, Science, 171(3975), p.1008-
Tyrell T., 1999, The relative influences of nitrogen and phosphorous on oceanic primary
production, Nature, 400(6744), p.525-
a
b
This page looks at: