Estuarine: Biological
Falmouth, 2014
This page looks at:
 Click here for results table
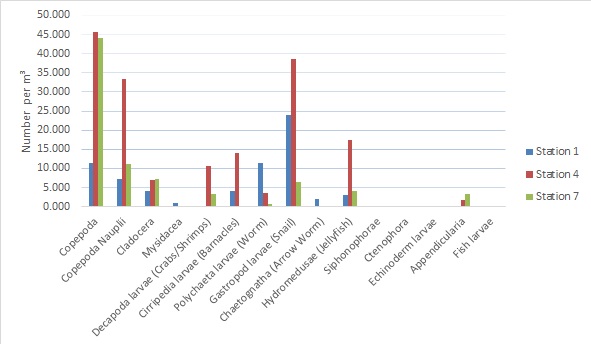
Figure 1: The number per m3 and species of Zooplankton at stations 1, 4 & 7 on 23/06/2014.
Figure 1 shows there to be most zooplankton at Station 4 and least at Station 1. The most common type of Zooplankton seen over all stations is Copepoda, followed by Gastropod larvae and then Copepoda Nauplii. Copepods, are known for migrating vertically in the water column and as we sampled only at the surface, total numbers may have been underestimated. In the case of Copepods this is often in the middle of the day to avoid predation (Fulton III, 1984), this diel migration (surfacing at night) has also been observed in Gastropod larvae (Romero, et al., 2012). There are also many types of Zooplankton not seen in this sample, including Siphonophorae, Ctenophora, Echinoderm larvae and Fish larvae. It has been recorded that Ctenophora are often associated with a decrease in other Zooplankton, particularly a decrease Copepods, this often occurs in the middle of summer (Fulton III, 1984).
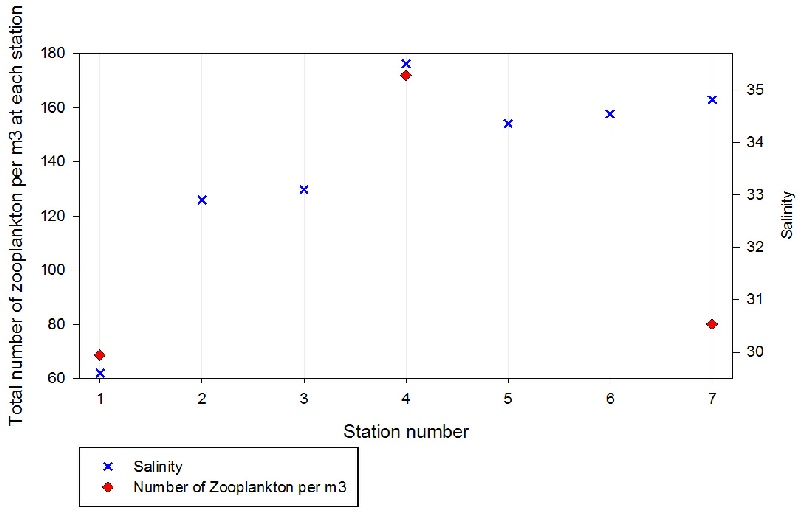
Figure 2: Shows the total number of Zooplankton per m3 at each station and the Salinity at each station on the 23/06/2014.
In Figure 2 there is no distinct correlation between salinity and the number of zooplankton and no obvious distribution of zooplankton numbers as you go along the estuary. It is likely this means their distribution is relating to another factor such as phytoplankton biomass. However, this is hard to tell as we only have 3 values for Zooplankton numbers. It has been found, in both in the Mondego Estuary and Southampton Water, that the abundance of Cyclopoid Copepods is greatest in the upper estuary and decreases towards the estuary mouth (Gonçalves, et al., 2012), although this distribution will be species specific.
The first two zooplankton samples were taken before high tide up until we reached Station 6 at 14:12 UTC. The last sample was taken after high tide (14:21 UTC) before reaching station 7 for our last sample at 15:09 UTC . It has been shown that the distribution of zooplankton is affected by the tidal state along with whether it’s neap or spring tide. It was a neap tide on collection of these samples (Dolby, 2014). It has been found in the Mondego estuary that most copepod species were able to be identified at neap tide rather than during spring tide (Gonçalves, et al., 2012)
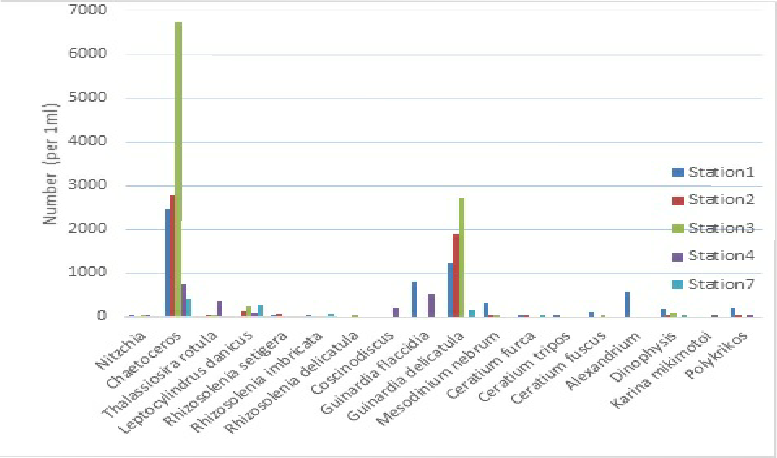
Figure 3: The number per m3 and species of Phytoplankton at stations 1, 2, 3, 4 & 7 at ~1m depth on 23/06/2014.
In contrast to the zooplankton distribution (above), Figure 3 shows the highest number of phytoplankton was at Station 3, followed by Station 1 and least at Station 7. The most common species of phytoplankton is Chaetoceros, followed by Guinardia delicatula and Guinardia flaccidia, all three types of diatom. Diatoms were the most common type of phytoplankton seen, followed by dinoflagellates and then ciliates. This may be due to diatoms preferring well mixed waters (Smol & Stoermer, 1999), such as the Fal Estuary. All of the different type of phytoplankton mentioned in Figure 3 are seen at some point in the estuary most are not seen at all stations. Ceratium tripos ,a type of dinoflagellate, was only seen at station 1. This could be as C. tripos is potentially a mixotroph (Mouritsen & Richardson, 2003). Low numbers of mixotrophs can indicate low growth rates of phytoplankton (Tittel, et al., 2003), this is likely to be the cause as the measured nutrient concentrations in the estuary were particularly low.
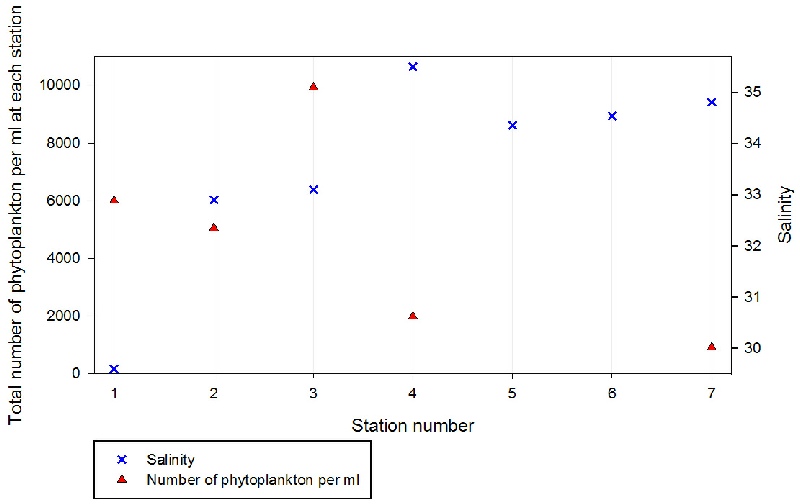
Figure 4: Shows the total number of Phytoplankton per ml at each station and the Salinity at each station at ~1m depth on the 23/06/2014.
(Mouritsen & Richardson, 2003). Low mixotrophs can indicate low growth rates of phytoplankton (Tittel, et al., 2003), this is likely to be the cause in our case as the measured nutrient concentrations in the estuary were particularly low.
Figure 4: Shows the total number of Phytoplankton per ml at each station and the Salinity at each station at ~1m depth on the 23/06/2014.
From figure 4 you can see an overall trend of the number of phytoplankton decreasing as salinity increases, with an exception of station 3. This indicates that there’s more phytoplankton at the top of the estuary that at the mouth, this is likely due to nutrient concentration down the estuary. Station 3 has a higher phytoplankton count, although there is nothing to indicate this is due to nutrient concentrations, it is possible it’s due to human error while counting as different people were counting each sample so discrepancies are possible.
When these samples were taken the tide was coming in, up until we reached station 6 (reached at 14:12 UTC), then the tide was going out for station 7 (reached at 15:09 UTC) as high tide was at 14:21 UTC (Dolby, 2014).
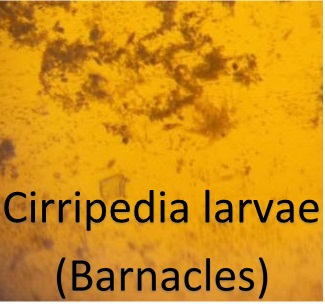
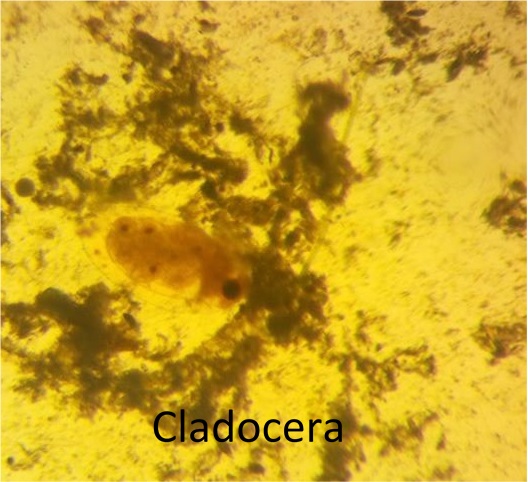
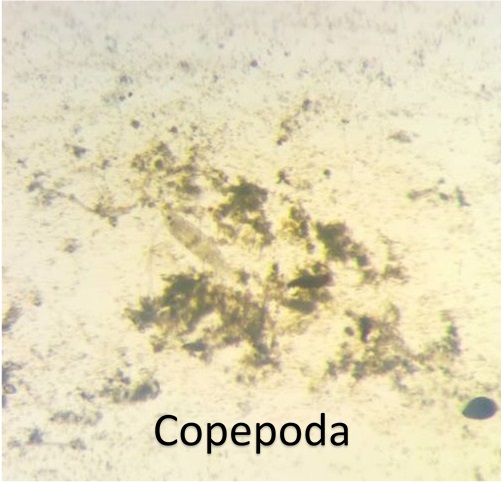
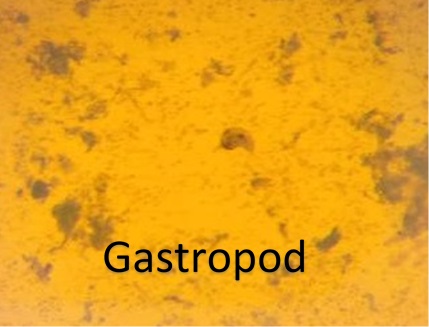
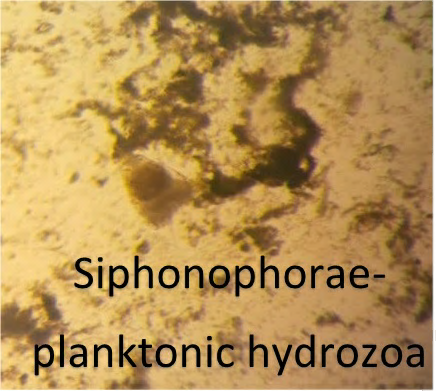
These are some photos of some of our zooplankton samples in the microscope:
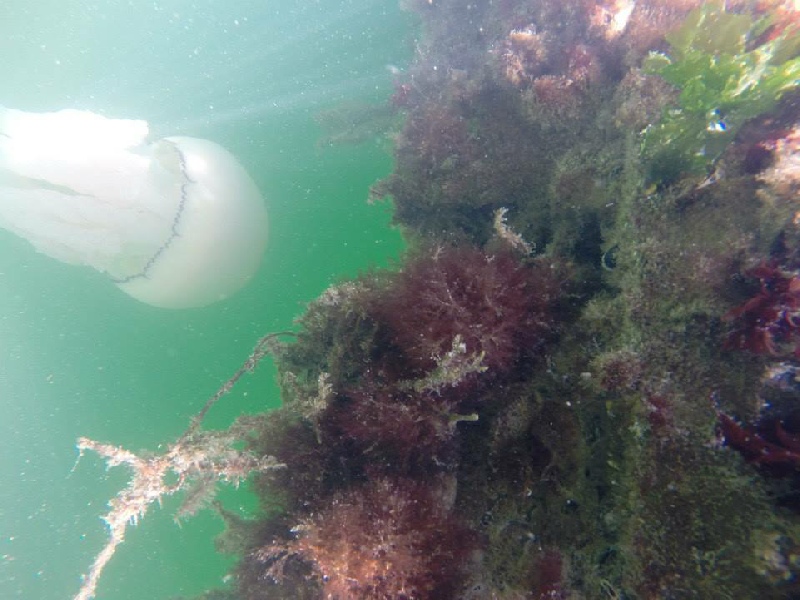
On the pontoon we spotted a particularly large Barrel Jellyfish which we believe is the one featured in a BBC news article which is thought to weigh 20kg and be ~1m in diameter (BBC, 2014). Here’s a photo of the Barrel Jellyfish we saw:
Photo taken by Ophelie Humphrey
BBC, 2014. Giant 20kg jellyfish filmed off the Cornwall coast. [Online]
Available
at: www.bbc.co.uk/news/uk-
[Accessed 30 June 2014].
Dolby, D., 2014. tide times. [Online]
Available at: www.tidetimes.org.uk/falmouth-
[Accessed
29 June 2014].
Fulton III, R. S., 1984. Distribution and Community Structure. Estuaries, 7(1), pp.
38-
Gonçalves, A. M. et al., 2012. Diel vertical behavior of Copepoda community (naupliar,
copepodites and adults). Estuarine, Coastal and Shelf Science, Volume 98, pp. 16-
Mouritsen, L. T. & Richardson, K., 2003. Vertical microscale patchiness in nano-
Romero, M. R. et al., 2012. Larval Diel Vertical Migration of the Marine Gastropod
Kelletia kelletii (Forbes, 1850). Journal of Marine Biology, Volume 2012, pp. 1-
Smol, J. P. & Stoermer, E. F., 1999. The Diatoms: Applications for the Environmental and Earth Sciences. Cambridge: Cambridge University Press.
Tittel, J. et al., 2003. Mixotrophs combine resource use to outcompete specialists:
Implications for aquatic food webs. Proceedings of the National Academy of Sciences
of the United States of America, 100(22), pp. 12776-
References
Click photo to enlarge