 back to top
Disclaimer: The views and opinions expressed are solely representative of the contributors, and are not necessarily condoned or supported by the University of Southampton and/or the National Oceanography Centre Southampton.
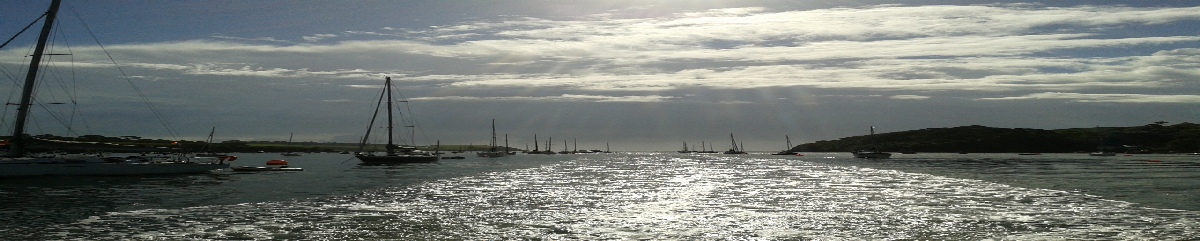
A survey of the Helford lower estuary was conducted using a sidescan towfish and a live video feed to determine the bathymetric features. The aim of the survey was to create a benthic habitat map. Habitat maps are essential for understanding of environments and the effects of human disturbance. Protection and management of these areas by fishing and shipping regulations has an important environmental feedback such as maintaining fish stocks (Davies & Young, 2008). The Fal and Lower Helford is a Special Area of Conservation (Langston, et al., 2003). The area studied is of scientific interest as it is near the boundaries of this conservation zone meaning that biodiversity may suffer from the effects of nearby trawling.
Method
-
-
-
-
Sonar frequency: 100khz
In the outer estuary, 4 parallel transects using a Sidescan towfish were carried out. Ground truthing with a grab was not possible in the nature reserve, therefore a video feed was used instead in particular areas of interest. The locations of the video snapshots are estimated from the start and end locations of the video recordings. Videos 3 and 4 intersected the sidescan transects.
The sidescan image was used to create a habitat map by marking out different zones of sediment types). An Excel spreadsheet was used to convert the raw data into distances on a track plot. The track lines were plotted using Surfer and the boundary points from the original sidescan profile added by hand. The finished profile (Fig 2) shows a depiction of the size and location of the zones.
Video feeds 3 and 4 crossed over the sidescan transects. Biologically significant snapshots from the videos were used as a form of ground truthing of the relevant zones, organisms were visually classified using a photographic wildlife guide (Sterry & Cleave, 2012).
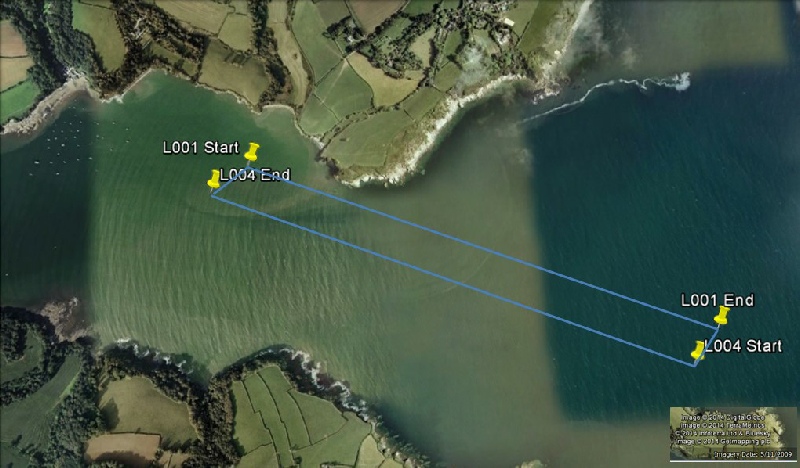
Figure 1: Google Earth 2009, Sidescan completed from 10:28 to 11:21 UTC in the 0.538km2
area indicated in the mouth of the Helford estuary.
Start of Line 1(L001): 050°
6’2.14°N 005° 6’24.84°W
Start of Line 4 (L004): 050° 5’36.24°N 005° 5’7.04°W
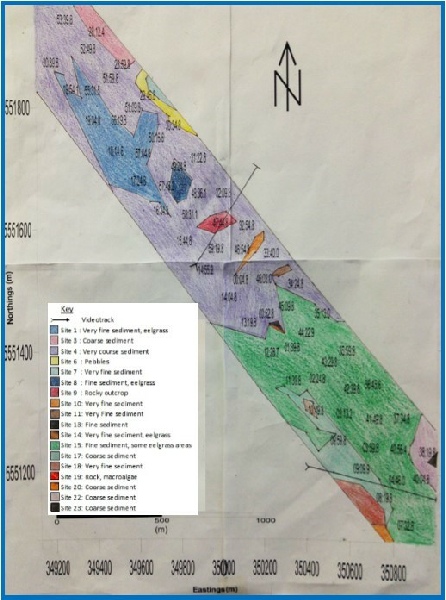
Figure 2: Sidescan profile. Created using Surfer and drawing on sites referring to sediment types. Videotrack indicates the approximate track of the boat during video recordings.
Findings
Zones on the final profile were classified by using knowledge of sediment reflectivity and comparison to the video feeds. The more reflective the sediment, the harder it was, indicating larger grain size. This showed up darker on the plot. The finest sediment was therefore white. Rocks showed as black marks with a white shadow which can be measured to indicate elevation. Short dashes indicated eelgrass or macroalgae.
Fine sediment
Fine sediment is likely to be from siltation from the Helford input.
The sidescan profile indicated that the largest area of fine sediment was Site 15.
Within this site, the video feed crossed an area of mud inhabited by little visible
epifauna or flora. Organisms such as the Great Scallop (Pecten maximus) (figure 4)
and the Thornback Ray (Raja clavata) (figure 5) were occasionally seen. Upstream
at Site 1 there was a large eelgrass bed which showed up as fine to very fine sediment
with small black dashes. As expected, the video feeds did not cross any eelgrass
beds, however; there were some small patches and areas of mixed macroalgae and seagrass.
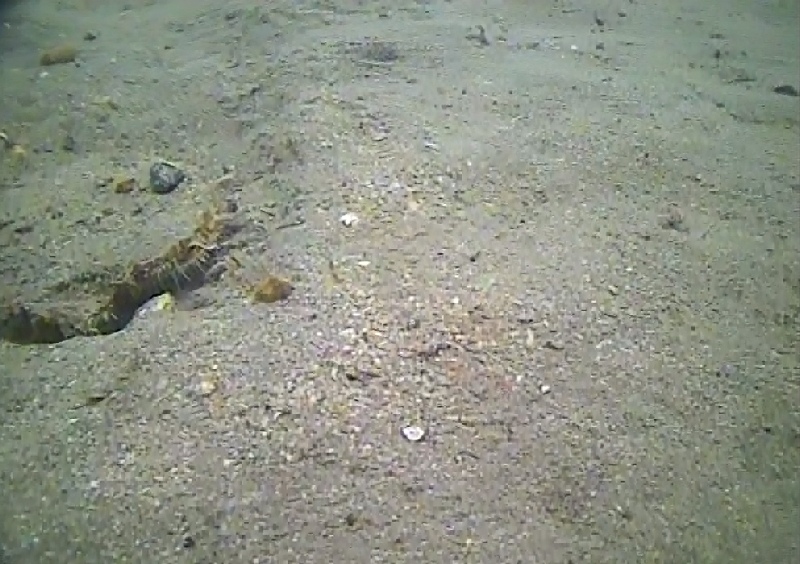
Figure 4: Sandy sediment, along downstream video transect, Site 15. There is little epifauna or flora, Great Scallop (Pecten maximus) is visible.
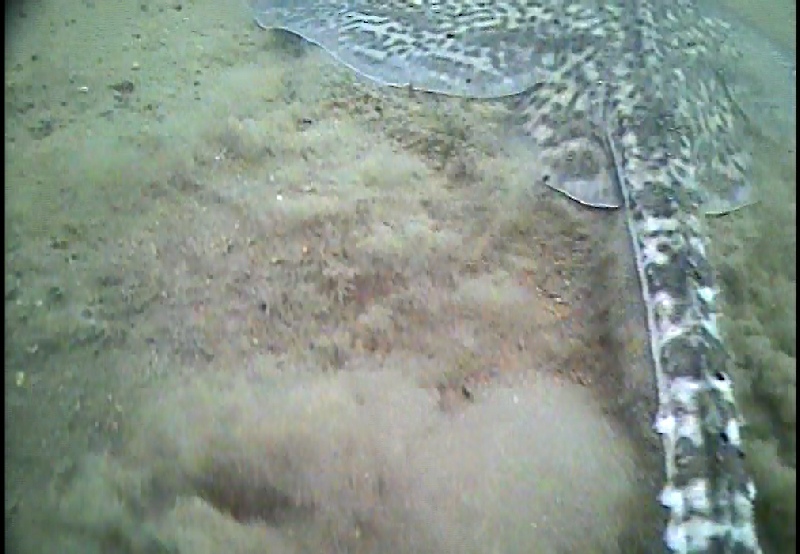
Figure 5: Fine muddy sediment along downstream video transect, Site 15. Thornback ray (Raja clavata) featured.
Coarse sediment
Larger grain size sediment was mostly found further upstream, this
is due to the river flow limiting deposition of finer grains as the flow velocity
is greater than the settling velocity for smaller grains. The largest distinct area
of coarse grain was Site 4. The video transect ran over this area, showing large
amounts of bivalve shells, some Maerl (figure 6). Rhodophyte macroalgae was sparse
and patchily distributed. It is likely that the boat drifted form the predicted transect
line as it missed the Site 9 rocky outcrop (figure 2). A similar bed type was recorded
by sidescan and verified by the video feed at Site 17. In this zone epifauna were
seen, such as the Spiny starfish (Marthasterias glacialis) (figure 7). A zone with
larger pebbles and gravel was also indicated at Site 6 by the black specks with white
shadows on the sidescan profile.
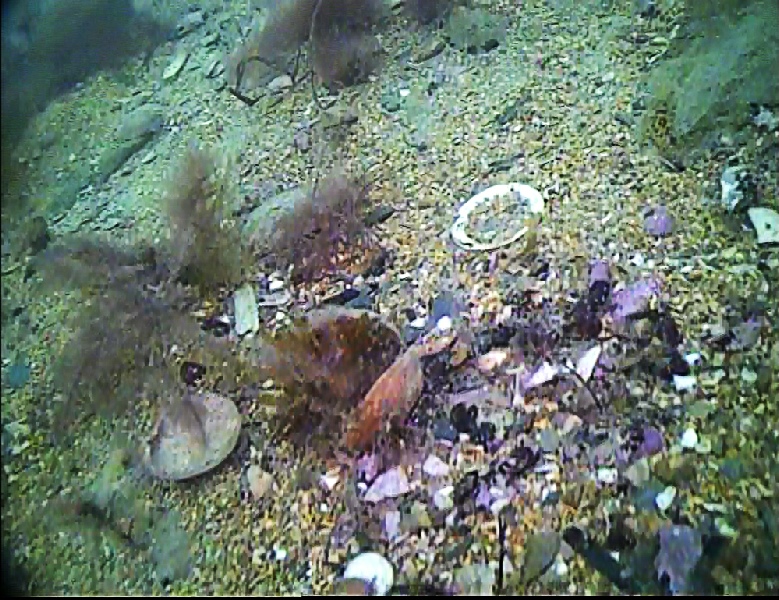
Figure 6: Coarse sediment along the upstream transect, Site 4. Bivalve shells visible and Maerl fluorescing purple under the blue light.
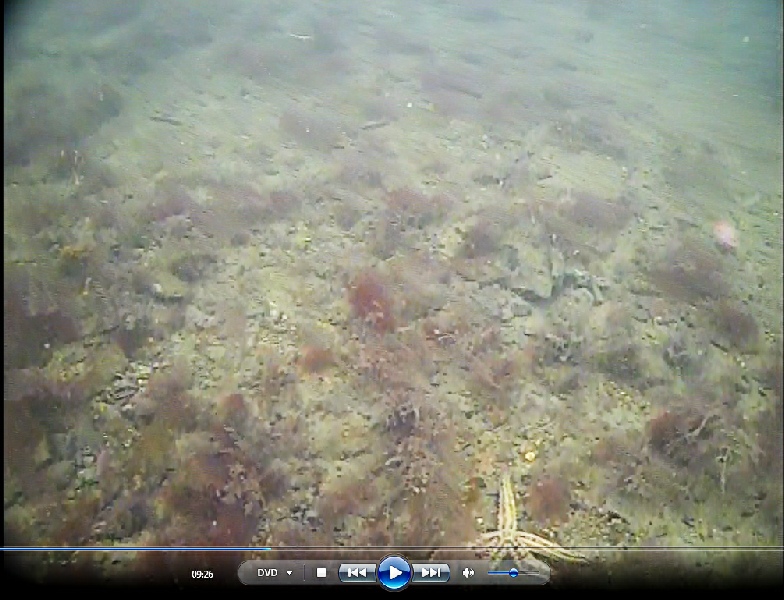
Figure 7: Coarse sediment with some rocks, upstream video transect, Site 4. Spiny starfish (Marthasterias glacialis) as an example of some of the visible macrofauna.
Rocky outcrops
The sidescan profile indicates the presence of rocky outcrops at Site
9 by the large black shapes with a white shadow (figure 2). Rock is also indicated
at Site 19 as the image is very dark. However the shape and height of the rock is
indistinct due to the black dashes covering it. The video feed in fact confirmed
it to be a macroalgae reef. This supported a diverse variety of macrofauna, in particular
wrasse such as Goldsinnys and Cuckoo wrasse and Edible crab (Cancer pagarus) (figure
8).
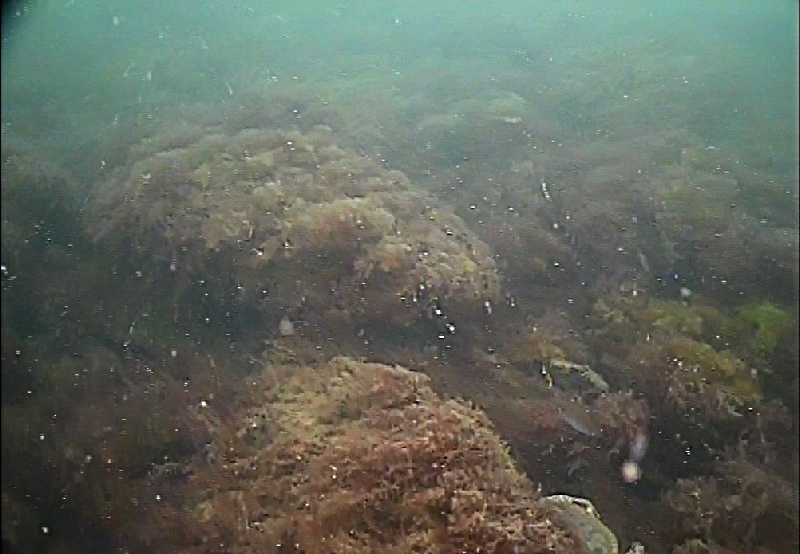
Figure 8: Macroalgae reef colonising rocky outcrop, downstream video transect, Site
19. Edible crab (Cancer pagarus) (lower-
References
Davies, J. & Young, S., 2008. The MESH Guide to Marine Habitat Mapping: asynopsis. Peterborough: Joint Nature Conservation Committee.
Langston, W. et al., 2003. Site Characterisation of North West European Sites: Fal and Helford cSAC, Plymouth: Marine Biological Association of the United Kingdom occasional publication No. 8.
Sterry, P. & Cleave, A., 2012. Collins complete guide to British Coastal Wildlife. London: HarperCollins Publishers Ltd..
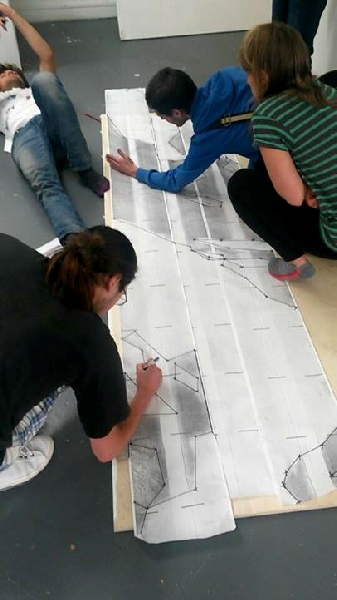
Figure 3: Undergraduates hard at work analysing the side scan trace.