 back to top
Disclaimer: The views and opinions expressed are solely representative of the contributors, and are not necessarily condoned or supported by the University of Southampton and/or the National Oceanography Centre Southampton.
Date: 30/06/14
Time: 12:00 to 15:00 UTC
Conditions: 7/8 cloud; light breeze.
Low tide:
13:29 UTC
The aim of the survey was to find the effect of time on various parameters in the
water column. This was achieved by deploying a YSI probe and current meter at 30
minute intervals.
The YSI probe was used to measure temperature, salinity, depth,
pH, turbidity, chlorophyll and dissolved oxygen at 1 meter intervals in the water
column. A flow meter then collected flow rate data throughout the entire water column.
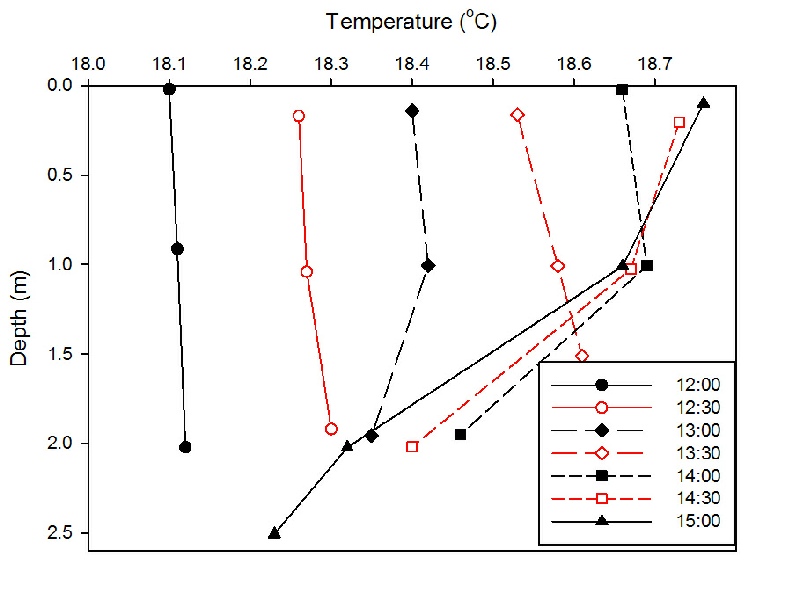
Figure 1: Temperature depth profile over time at the pontoon near King Harry ferry. Each line represents measurements at half hour intervals according to the key UTC.
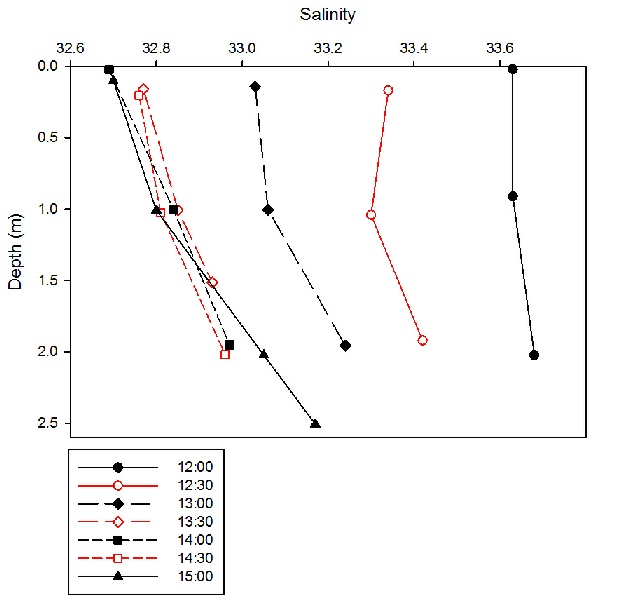
Figure 2: Salinity depth profile over time at the pontoon near King Harry ferry. Each line represents measurements taken at half hour intervals according the key UTC.
Figure 3: A graph depicting the fluctuations in flow speed over time at the King Harry pontoon. Each line represents measurements taken at half hour intervals according to the key UTC.
Figure 5: A graph showing changes in Richardson Number with time at 2 depths; surface and 1m, at King Harry pontoon.
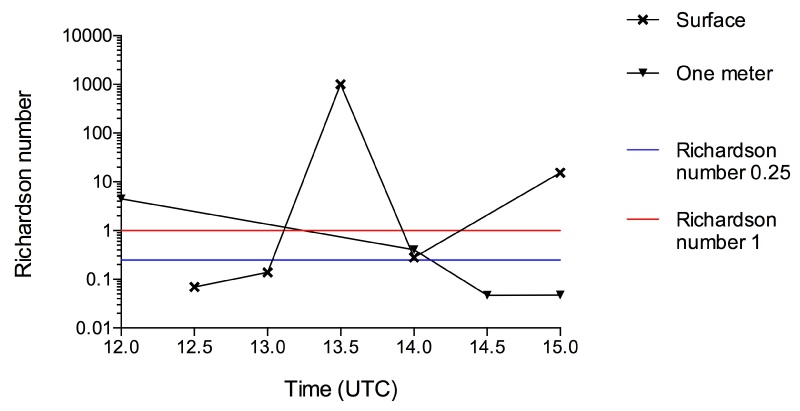
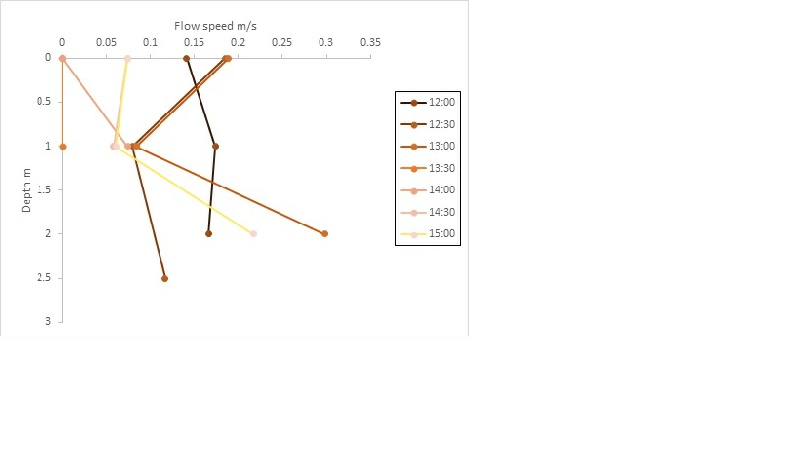
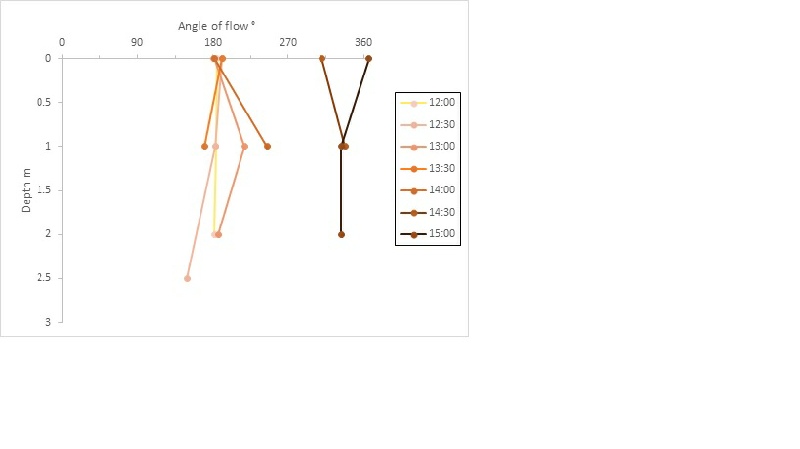
Figure 4: a graph depicting the fluctuations in the direction of the flow over time at the King Harry pontoon. Each line represents measurements taken at half hour intervals according to the key UTC.
Approaching low tide, the water temperature increased overall (figure 1). This is likely to be due to the body of water heated by the sun being smaller. Additionally, the slackening flow means less of the warm water is moving down stream and there is less mixing. There is a slight overall increase in temperature for an hour after the low tide; this is likely to be due to a slack before the flood. The temperature then decreases slightly at the beginning of the flood tide as there is cooler water flowing upstream. The water column is generally warmest in the middle, at approximately 1m. This could be because the surface the water may be cooled by the breeze and fluvial input during this period of minimum tidal forcing.
The salinity decreases towards the low tide at 14:30 as the water is drawn from the estuary and fluvial input is dominant (figure 2). The expected increase in salinity during the beginning of the flood is not observed to occur. This could be due to a slack tide before a significant input of saline water is apparent. The salinity is consistently greatest at the bottom of the water column. This is likely to be due to less dense fresh water flowing through the surface.
The flow dynamics changed over the 3 hours around low tide. During the ebb tide the flow speed is variable but at a consistent angle leaving the estuary (figures. 3, 4). At low tide there is no flow which is due to no tidal action during slack flow. However, there should be some slight movement from the fluvial flow; this is likely to be absent due to such slow speed that it is not detectable by the flow meter (figure 3). During the flood tide there is a general increase in flow speed as water is driven upstream by the tide (figure 3). This can be interpreted to be consistent with the switch in angle of surface flow by 180° (figure 4). However; there was a great deal of variation of readings during measurement, meaning this could be incorrect, hence why it doesn’t match with the Richardson numbers (figure 5).
Figure 5 shows Richardson numbers plotted at two depths (surface and 1m) against time. Flow is turbulent throughout the time series, apart from between 13:00 and 14:00 UTC. Measurements at 12:00 UTC also appear to display laminar flow; however, there was an error in the data collection at this site so this data plot may be an anomaly.
Low tide was at 13:29; therefore slack water would have been around this time, explaining the lack of turbulence at these points. As the tide ebbs advances towards low tide, the flow speeds decreases to the point where there is no difference in flow speed with depth. This explains why laminar flow is present and why there is a large Richardson number.
Laminar flow occurs at the surface at 15.00 hrs due to there being a relatively small change in flow velocity between the surface and 1m, so minimal shear between layers.
Turbulence on the incoming tide from 14.30 to 15.00 hrs at 1m is expected due to the flooding sea waters mixing with the outflowing fresh water, causing relatively large variations in shear and flow speed between water bodies.