 back to top
Disclaimer: The views and opinions expressed are solely representative of the contributors, and are not necessarily condoned or supported by the University of Southampton and/or the National Oceanography Centre Southampton.
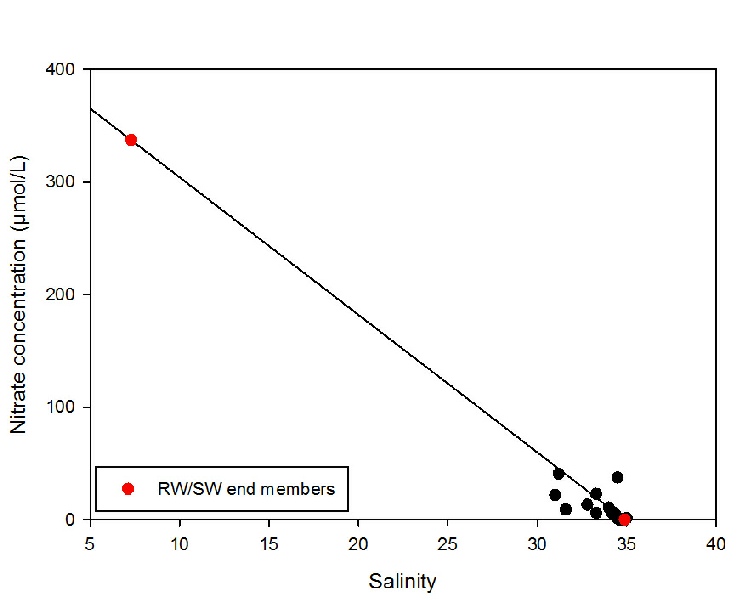
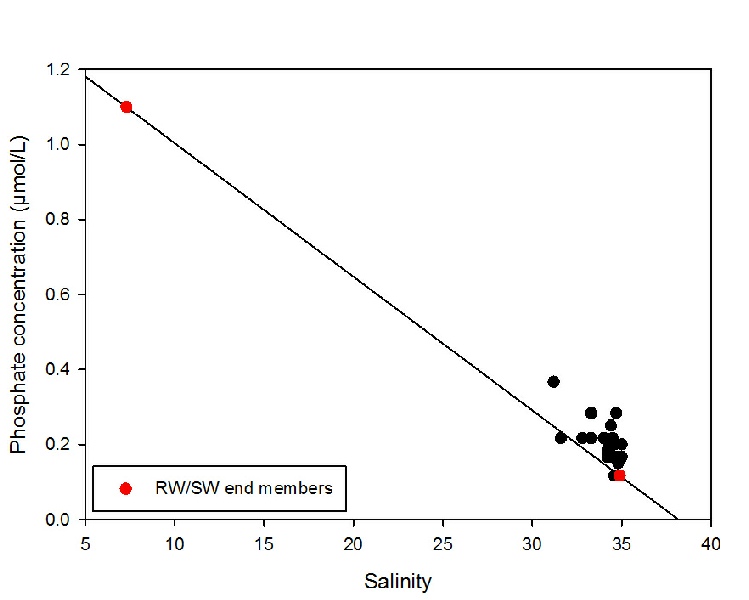
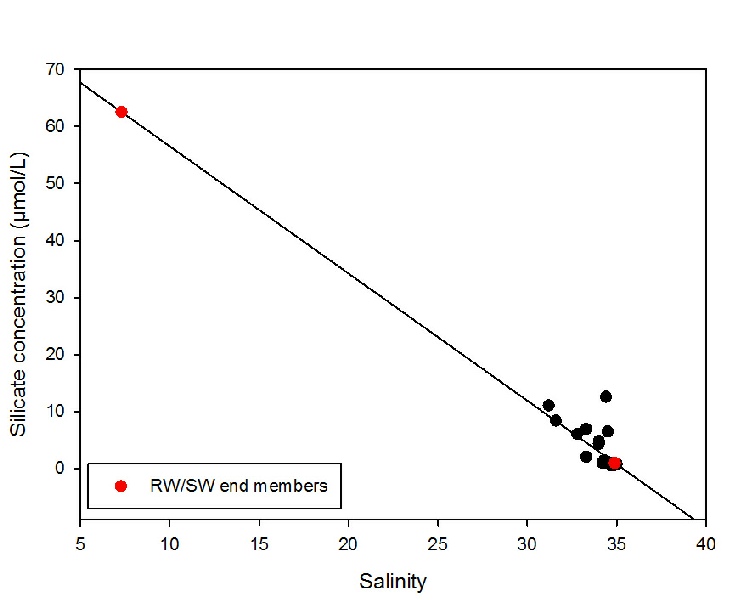
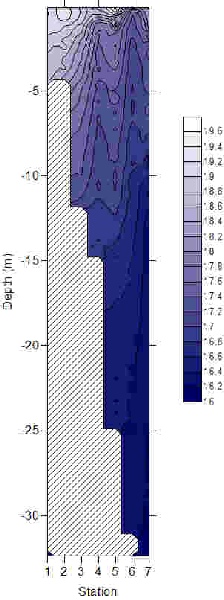
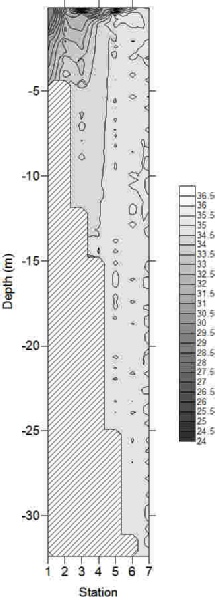
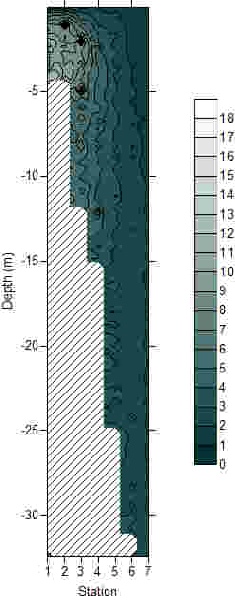
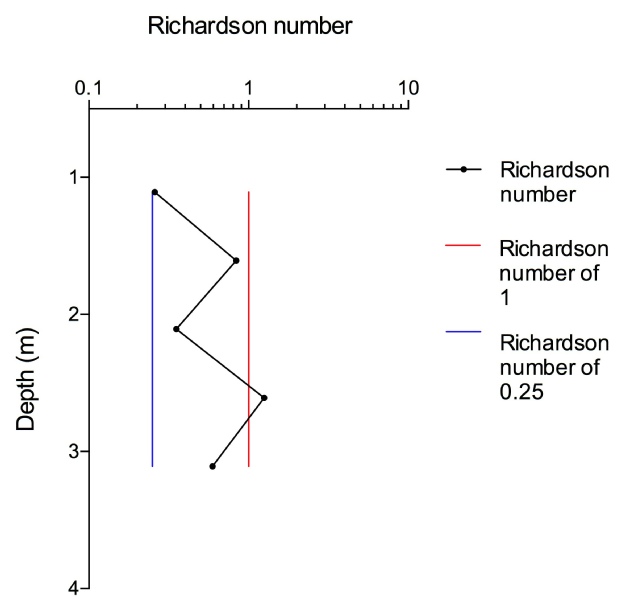
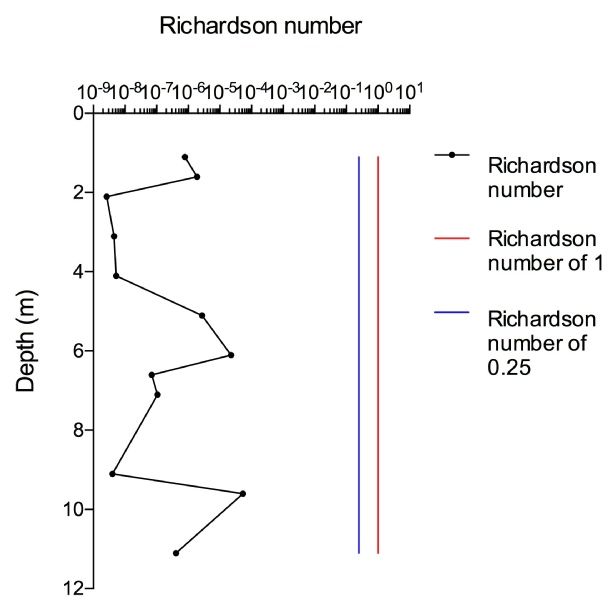
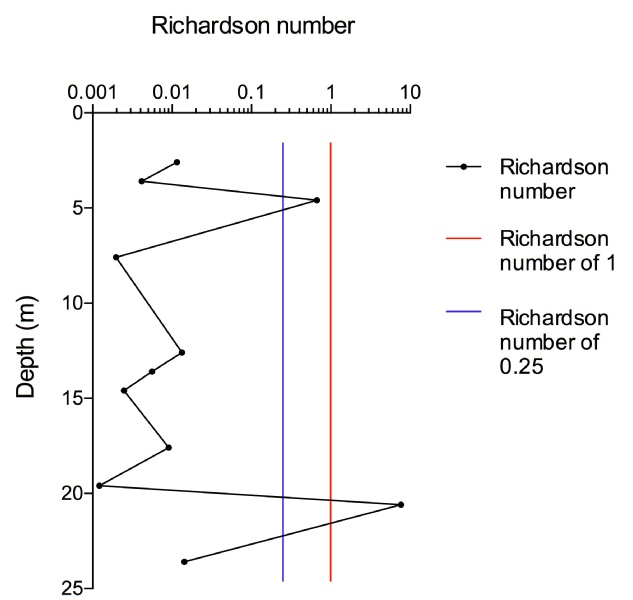
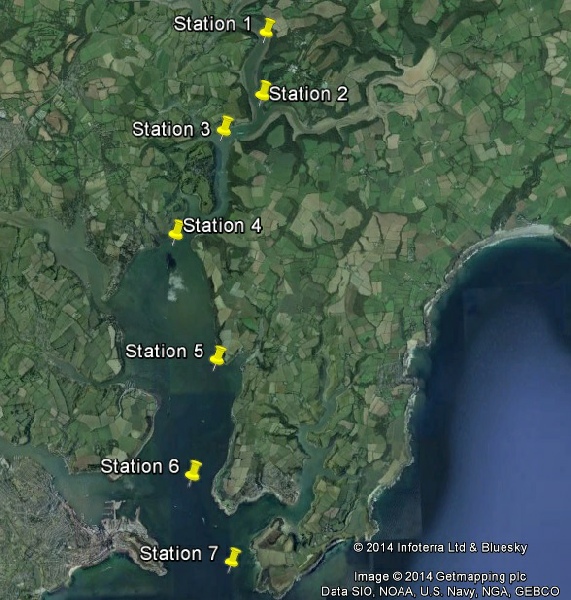
Figure 1: Google Earth image (2014) showing location of the 7 stations along Carrick Roads. The locations of the stations were as follows.
1 -
2 -
3 -
4 -
5 -
6 -
7 -
Estuaries are important transition zones between riverine and marine environments. Rivers act as a major source of many elements, such that an understanding of the cycling of said elements is crucial in examining marine budgets (Dyer, K.R. 1997). The Fal estuary is characterized by elevated metal concentrations and hypernutrification. Data on the following parameters was collected: biological data, consisting of phytoplankton samples and zooplankton tows; physical data on the temperature and salinity structure; chemical data including dissolved oxygen, nitrate and phosphate, silicon and chlorophyll. This data was collected via sampling at 7 stations (figure 1).
Figure 2: Nitrate estuarine mixing diagram for the region of the Fal estuary surveyed. SW end member was defined as the most saline sample taken.
Figure 3: Phosphate estuarine mixing diagram for the region of the Fal estuary surveyed. SW end member was defined as the most saline sample taken.
Figure 4: Silicate estuarine mixing diagram for the region of the Fal estuary surveyed. SW end member was defined as the most saline sample taken.
The riverine end member of nitrate is at a higher concentration than the seawater
end member (figure 2). This is the case for most elements, as rivers are usually
the main source. The majority of data points lie beneath the theoretical dilution
line (TDL) at the seawater end member, suggesting removal of nitrate by biological
processes, nitrate thus exhibiting non-
RW
SW
TDL
RW
SW
TDL
RW
SW
TDL
Again, the riverine end member of phosphate is at higher concentration than the seawater
end member (figure 3). However, this time there is addition of phosphate as the data
points lie above the TDL. These findings reflect anthropogenic induced hypernutrification,
such that phosphate exhibits non-
Silicon is also non-
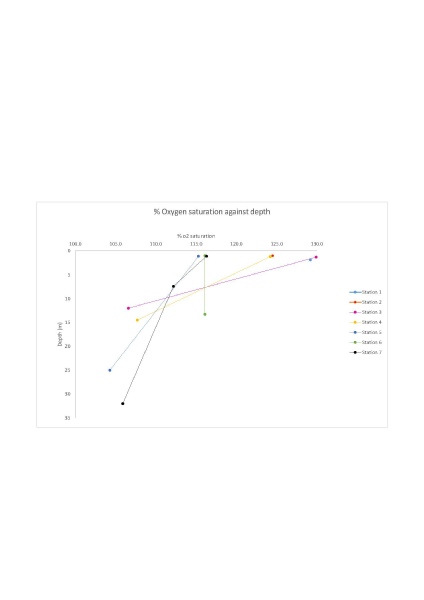
Figure 5: Percentage oxygen saturation with depth for all seven sites sampled across the Fal estuary.
As we move down the estuary from Station 1 through Station 7, the surface dissolved oxygen decreases (figure 5). The range of dissolved oxygen throughout the water column is far wider at the riverine stations than the marine ones. This can be correlated to nutrient and consequentially phytoplankton abundance. Nutrients are highest in the riverine end of the estuary, hereby accommodating high phytoplankton abundances which produce oxygen by photosynthesis. The riverine end of the estuary is a more variable environment than the marine end, such that nutrients and consequentially dissolved oxygen demonstrate greater variability.
Figure 6 (left):A temperature contour map of the Fal estuary.
Figure 7 (centre): A salinity contour map of the Fal estuary.
Figure 8 (right): A chlorophyll contour map of the Fal estuary.
Note that the distance between the stations is not equal, nor is representative of the temperature, salinity chlorophyll fluctuations that may or may not be present.
Temperature (oC)
Salinity
Chlorophyll (µmol/L )
As we moved from the riverine (station 1) towards the saline end (station 7) of Carrick Roads, the water depth increased. As expected from a stable water column, temperature decreases with increasing depth (figure 6). Furthermore, the surface temperature decreases towards the saline end of the estuary as the less dense, warmer riverine water sinks below the colder sea water. Thermoclines are well pronounced as insolation isn’t strong enough to cause stratification yet, reaching a depth of about 13m.
Salinity increases with depth, in accordance with a stable water column (figure 7).
The haloclines are more pronounced towards the riverine end of the estuary, due to
interactions between fresh-
Chlorophyll concentration is highest towards the riverine end of the estuary; there are subsurface chlorophyll maximums in the first 5 metres (figure 8). Increased chlorophyll levels are due to increased phytoplankton abundance. As rivers act as a major source of many nutrients, more phytoplankton will accumulate at the riverine end than seawater end.
Figure 9 (left): Fluctuations in Richardson numbers with depth at station 1.
Figure 10 (centre): Fluctuations in Richardson numbers with depth at station 3.
Figure 11 (right): Fluctuations in Richardson numbers with depth at station 7.
The Richardson Number measures vertical mixing and is a ratio of the density gradient to velocity shear. If Ri< 0.25, flow is turbulent leading to increased vertical mixing. If Ri>1, flow is laminar. If the Richardson Number is between 0.25 and 1 the flow is undefined, i.e. it can be either laminar or turbulent (Knauss, J.A. 1997).
At station 1 (figure 9), most of the flow lay between a Richardson Number of 0.25 and 1 and thus cannot be classified. At a depth of ~2.5m the Ri number was above 1 and flow was laminar. Station 1 was located at the riverine end of the estuary, where tidal interaction is relatively low. Consequentially, shear and thus vertical mixing between fresh and seawater was minimal.
Station 3 (figure 10) is characterized by the lowest Reynold’s Numbers along the sampling track, implying strong turbulence and thus high vertical mixing. The station is located at the intersection between the River Fal and River Truro, where shear between the 2 flows causes increased vertical mixing.
Station 7 (figure 11) lies at the mouth of the estuary where tides have the greatest influence. Shear between fresh and saline water leads to turbulence and thus vertical mixing. The general trend seems to be that Richardson Numbers decrease, i.e. flow becomes increasingly turbulent, as we move southward down the estuary.
References:
Knauss, J.A. 1997, Introduction to Physical Oceanography, Second Ed., Waveland Press Inc., United States of America
Dyer, K.R 1997, Estuaries: a Physical Introduction, Second Ed., Wiley