


Introduction
Lagrangian measurements of temperature, salinity, irradiance and current speed with direction were taken at the King Harry Ferry Pontoon in the Fal Estuary (50o 12’57N, 005o1’39W). Measurements were taken between 13.30UTC and 15.20UTC. The data from the pontoon were collected to determine changes in the water properties over the tidal cycle. The King Harry Chain Ferry and some smaller boats traversed the channel at regular intervals; this may have caused less stratification than would be expected.
These measurements are used as part of a time series taken over the fortnight. This means that comparisons between offshore and estuary measurements can be made, to see if changes at other locations are due to temporal or spatial variations.
Method
Measurements were taken every 30 minutes, using a variety of instruments at the surface and at 1 meter intervals to the seafloor.
The temperature and salinity were measured using a YSI probe, accurate to 0.0001oC and 0.001psu.
Current speed and direction were measured using the Valeport current meter, which orientated itself in the direction of flow.
Irradiance was measured using a light meter. The meter had two sensors, one on the pontoon and one lowered into the water. The sensors measured the amount of downwelling light. Irradiance measurements may have been affected by boat movement as sediment would have been stirred up into the water column.
Click on the images to see an enlarged version..
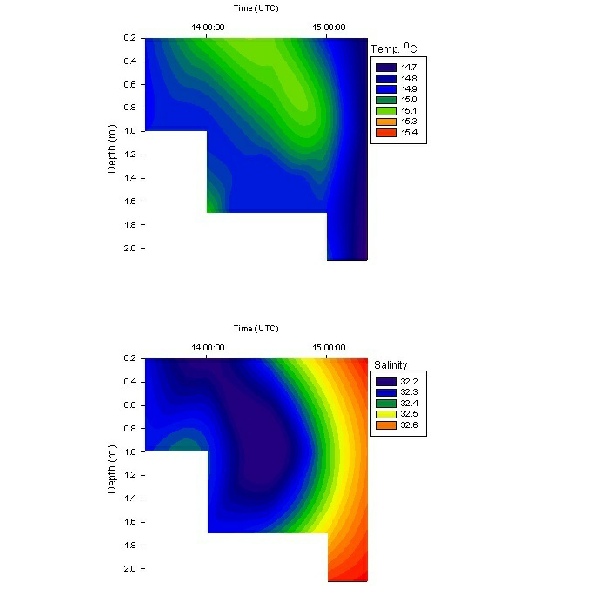
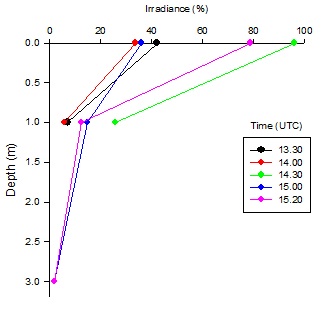
Figure 1.
Figure 2
Discussion:
As seen in figure 1, irradiance within the water column decreases with depth. The most rapid decrease in irradiance at each time interval occurs within the first meter. The surface irradiance changes between time intervals; this was most likely due to variation in cloud cover with time. Therefore an increase in depth due to the flood tide appears to have no effect on turbidity and the attenuation of light.
Figure 2 shows that generally as depth increases the temperature of the water decreases. This is due to surface of the water being heated solar radiation; the heat is then transferred by mixing with the rest of the water column creating a gradual change in temperature. As the flood tide occurred the temperature began to increase. The ocean water mass is warmer than the river water, as the flood tide pushes the oceanic water up the estuary this causes the temperature rise seen from 14:00 – 15:00 UTC.
As the flood time occurred the salinity starts to increase, as seen in figure 2. The variation is fairly small. The increase in salinity is due to the saltwater from the ocean being pushed up the estuary, this water has a higher salinity than the riverine water. The increase in salinity is quite gradual, again occurring between 14:00 and 15:00 UTC.
A current meter was also used at the station, the instrument was malfunctioning. The meter gave readings that were clearly incorrect, and so the data has been excluded from the results and analysis.