
Vessel: R.V. Bill Conway
Introduction:
The Fal estuary was sampled from the riverine end to the offshore oceanic end over
the course of 6 stations. The sampling began at the station closest to the river
Fal and were taken against the in-
Methods:
CTD
The CTD was deployed from the back of the R.V. Bill Conway. On the initial profile, data was collected for temperature, salinity, irradiance and fluorescence. This profile was used to indicate where to fire the Niskin bottles to collect samples within the differing water masses on the upward profile, whilst still collecting data on the various parameters.
Zooplankton Net
At stations 1,3 and 6 a 50cm diameter, 100µm mesh zooplankton net was deployed from the back of the ship and was towed for a period of 5 minutes to collect a sample to represent the species present at that station.
Secchi Disk
At all 6 stations the secchi disk was deployed. At some of the stations the deployment was repeated 3 times so that an average could be calculated. The secchi disk depth is then multiplied by 3 to calculate the depth of the euphotic zone.
Click on the figures to see an enlarged version with figure label.
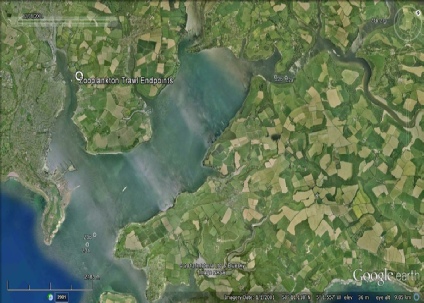
Figure 2. Map to show the 3 stations at which zooplankton were sampled in the estuary (where 'a' refers to deployment of the plankton net and 'b' refers to collection.
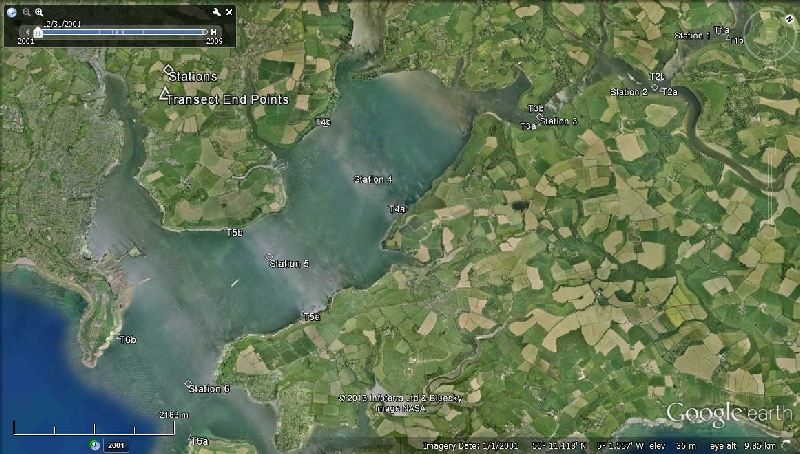
Figure 1. Map to show the 6 stations sampled in the estuary research and the 6 ADCP transects at each station (where 'a' refers to transect start and 'b' refers to transect end.
Discussion:
Theoretical Dilution Line
Nitrate-
From 0 to seawater salinity, the nitrates are observed exhibit conservative behaviour,
with little deviation from the TDL, though the readings are very close to the seawater
end-
Phosphate-
Phosphate may be non-
Dissolved Silicon-
Dissolved Silicon appears to follow conservative behaviour, despite the presence
of a datum at 100µmol l-
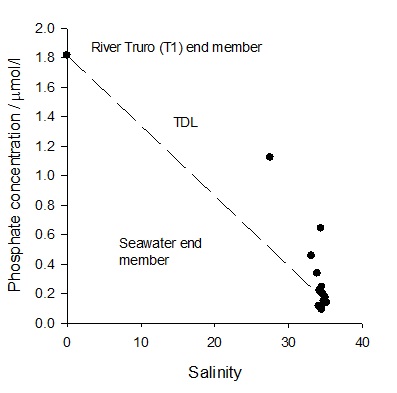
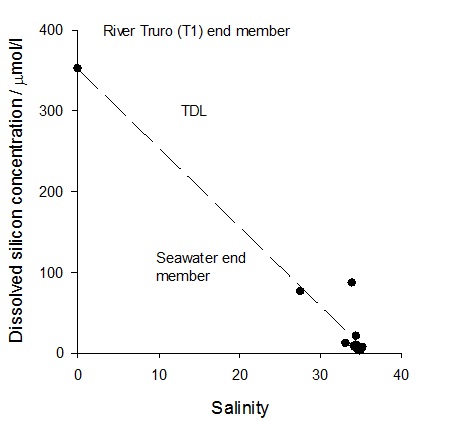
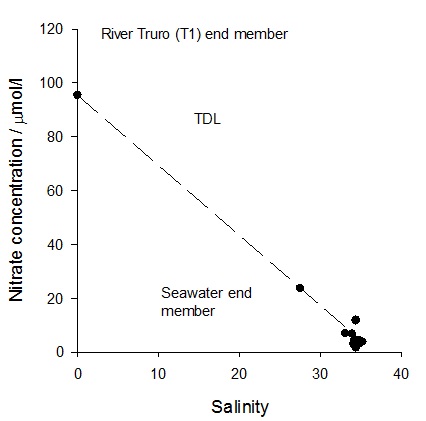
Figure 3.
Figure 4.
Figure 5.
Click on the figures to see an enlarged version with figure label.
Nutrients
The major rivers which flow in to the Fal estuary are the Truro River and the Falmouth
River. Two large granite bodies occur within the catchment geology of the Falmouth
River. Granite has a high content of silicon, thus high dissolved silicon concentrations
in the Fal estuary are to be expected due to weathering and erosion of the underlying
rock. The phytoplankton community appears to be dominated by diatoms at all 6 stations
along the estuary (Figure 22). The presence of diatoms and other siliceous phytoplankton
will result in dissolved silicon being readily removed from the water column. Due
to resource limitations only two depths were sampled at stations 1, 2 and 3(Figures
6-
At stations 1 and 2 oxygen increases as chlorophyll concentrations decrease, this may be due less utilisation of oxygen by zooplankton at this depth and station relative to oxygen production through photosynthesis by phytoplankton. The zooplankton trawl occurred at the surface therefore there is no data available to confirm this conclusion.
At station 3 dissolved silicon decreases as chlorophyll increases, suggesting the phytoplankton population is dominated by diatoms. The chlorophyll maximum occurs below the 1% light level, which may be attributed to a time lag in utilisation of photon, by migrating benthic diatoms. This feature may also be attributed to in accurate measurements of the secchi disc depth, as secchi disc measurements are subject to human error.
At station 4 the highest concentration of chlorophyll occurs at the same depth as the highest concentration of silicon, this suggests the presence of a diatom bloom. As nitrate is high at this depth the limiting factor on the bloom is most likely dissolved silicon. The concentration of chlorophyll then begins to decrease as the 1% light level approaches suggesting that phytoplankton is then limited by light.
At station 5 a sample was lost from 16m depth which reduces the accuracy of the representation of the water column here. Phosphate concentration remains constant with depth which is unusual as it is an essential element for primary production which can be seen as occurring due to chlorophyll being present. This may however be an anomalous result due to human error in sampling or lab analysis.
The position of the chlorophyll maximum changes between stations 1 to 6. The chlorophyll maximum deepens between stations 1 and 3, and then begins to shallow between stations 4 and 6. Primary production appears to be limited by different factor at different stains but no clear pattern can be observed. This may be due to the physical nature of the estuary. The Fal estuary is well mixed and therefore stratification cannot pose limits on nutrient availability as they are constantly resupplied by turbulent mixing caused by tidal forcing. At some stations however nutrients appear limiting but generally light would be the major limiting factor. This can vary up the estuary due to changes in turbidity and water depth over the tidal cycle.

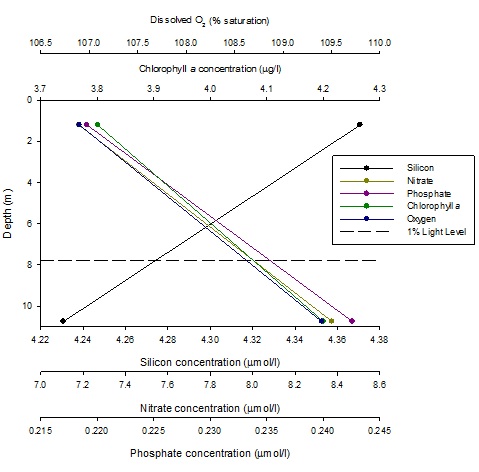
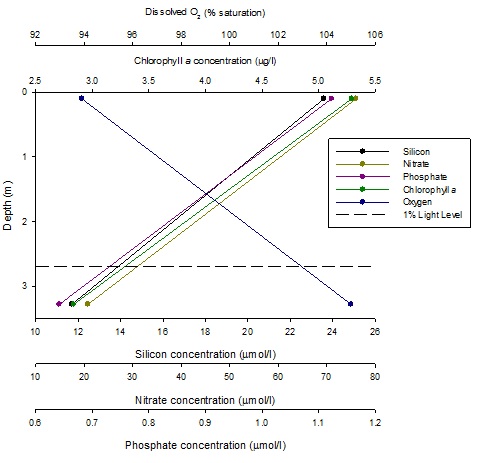
Figure 6.
Figure 7.
Figure 8.
Click on the figures to see an enlarged version with figure label.
Labs:
All instruments used when handling water samples were washed with an aliquot of the sample before use to ensure no contamination occurred.
Oxygen sampling: During collection of oxygen samples care had to be taken to prevent the introduction of oxygen from the external environment. Water samples were collected in glass bottles and Winkler reagents, manganous chloride and alkaline iodide, were added to the water samples before storage in cold water as outlined in Grasshoff et al7.
Phytoplankton sampling: 100ml of water were measured and transferred into labelled
glass bottles, which contained Lugol’s iodine in order to stain and preserve the
phytoplankton within the sample. In the lab the sample was then reduced to 10 ml
using vacuum filtration. The samples were then placed in a sample vial and analysed
using a microscope. 1 ml of the sample was placed on a Sedgewick-
Nitrate and Phosphate: Onboard 50ml were measured and filtered using a microfiber filter in to labelled glass bottles and stored in a cooler. In the lab dissolved nitrate was measured using the procedure outlined in Johnson and Petty8. The phosphate concentration was measured using the procedure outlined by Parsons et al9.
Dissolved Silicon: 50ml of the water sample were filtered through a microfiber filter into plastic bottles and were stored in the cooler box. Analysis of the dissolved silicon is outlined by Parsons et al9
Chlorophyll: Chlorophyll which collected on the filter were retained and stored in test tubes, containing acetone, in the fridge. The concentration was then measured in the lab using the flurometer as outlined in Parsons et al9.
Zooplankton: A horizontal trawl lasting 5 minutes was used to collect the zooplankton sample using a net of 0.5m diameter and mesh of 100 1L plastic bottle and 10% Formalin solution was added in order to preserve the sample. The zooplankton contained in 10ml were then counted under the microscope using a Bogarov tray. These counts were used to calculate the number of zooplankton that would be present in a cubic meter of seawater.
Click here to see a continuation of the Estuary results and discussion.
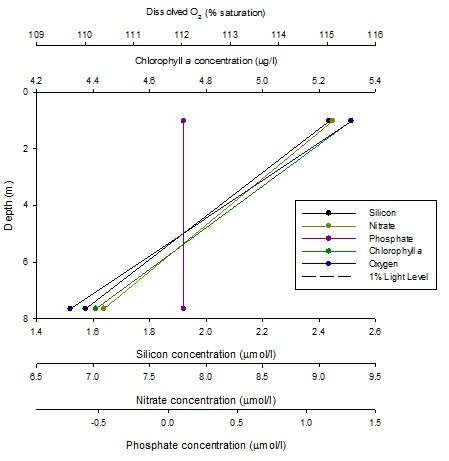
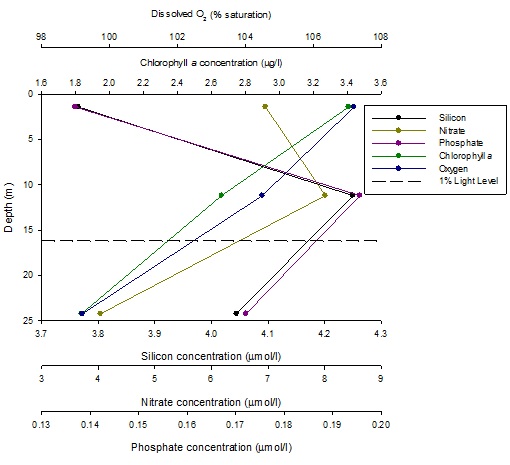
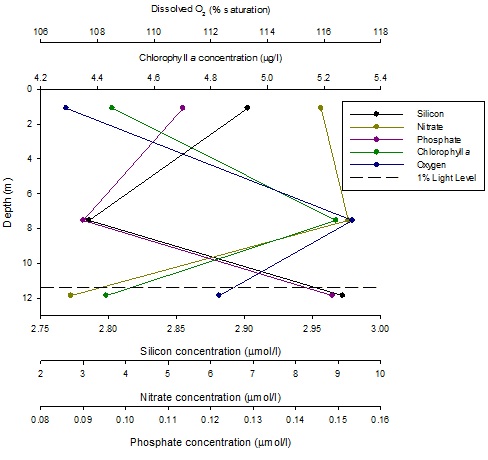
Figure 9.
Figure 10.
Figure 11.