Station. 4
CTD downcast data for station 4 (figure 12) showed a two-


Figure 12.
Figure 13.
Figure 14.

Figure 15.
Station. 5
The CTD downcast for Station 5 displayed a well-
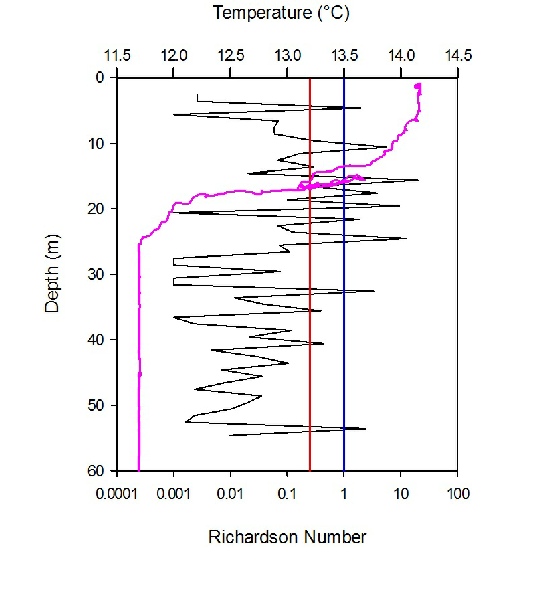

Figure 16.
Figure 17.
Figure 18.

Station. 6
Station 6 showed a partially mixed water column structure, with a less defined thermocline and pycnocline seen (figure 19). The water column became partially mixed due to the breakdown of the thermocline, caused by the increase in tidal effect as a result of being closer to shore. Phosphate, silicon and nitrate concentrations were all low at the surface, which correlated to high oxygen and chlorophyll concentrations (figure 20). As the chlorophyll concentration decreased with depth the oxygen showed a similar profile. This resulted in an increasing trend for all of the nutrients with depth, suggesting a lack of primary production. Low transmission throughout the whole water column suggested high turbidity (figure 19). The secchi disk measurements (figure 24) compliment the transmission data and reinforce the idea of high turbidity. The 1% light level calculated from the Secchi disk data was 24m.


Figure 19.
Figure 20.
Figure 21.

Phytoplankton:
Figure 22 shows the abundance of phytoplankton species at each of the 6 stations. The greatest abundance of phytoplankton was found at stations 1 and 6, located closest to the shore. The vast majority consisted of diatoms, of the genus, Chaetoceros, and to a lesser extent, various Rhizosolenia sp. The remaining 5% of the sample for stations 1 and 6 were made up of other diatom groups (Thalassiosira and Coscinodiscus) and dinoflagellates (Karenia mikimotoi, Dinophysis, Alexandrium, and Ceratium).
Station 3 had the third largest abundance of phytoplankton, at about 2000 cells per ml. This station was also third closest to shore. Diatoms were by far the most dominant genera, however there was a slight increase in the percentage of dinoflagellates. These sample sites were closest to the riverine nutrient inputs, explaining the observed higher phytoplankton abundance.
Further offshore, in stations 2, 4 and 5, phytoplankton counts are much lower. Diatoms remained dominant, although station 2 has a larger proportion of dinoflagellates, and rarer (at other stations) diatom genera, such as Thallasiosira. Stations four and five had higher proportions of large Rhizosolenia sp. suggesting these may be more adapted to scavenging the more limited nutrients further offshore. These low counts are at the same stations where zooplankton species are more abundant, and abundance may have diminished due to grazing.
Diatoms tend to outcompete other phytoplankton earlier in the bloom season, as they
are better adapted to higher turbidity. All stations had fairly homogenous transmission
profiles, which may favour diatomic plankton abundance down the water column. Whether
these transmission levels are high, thus favouring diatom blooms, may be clarified
by further study of time-
Zooplankton:
Figure 23 shows zooplankton species abundance at each of the sampled stations. Station 4 had almost double the number of zooplankton members per m3 (11,000,000) than the next largest, station 5, the other far offshore station. Copepods are the most abundant zooplankton at all stations. Other abundant groups include Cladocera, Chaetognatha, Appendicularia, and polychaete larvae.
Stations 1-
Figure 22.
Figure 23.
Figure 24.


Conclusions:
From onshore to offshore the water column became more structured. This will be due to a decrease in tidal mixing processes which prevent thermal stratification occurring. The water column also became deeper, reducing the effect of wind on mixing. Progression further offshore saw the thermocline deepening due to this reduction in turbulent mixing as is typical of seasonally stratified seas. As Summer temperatures rise and thermal stratification increases, the onshore/offshore nutrient gradient is likely to show a marked increase.
The measurements of abundance and identification of phytoplankton and zooplankton samples were carried out by many different members of the group. This inconsistency may have given rise to some deviation in results on both counts. The stations all represent a snap shot in time, so before solid conclusions can be made a time series for each station would need to be established for further analysis.
Offshore Discussion, (Continued)