![]()
On 5th July, a group of students travelled up the Tamar estuary to Calstock, Plymouth. From there, measurements were taken along the estuary at regular intervals of ~ 2 ppt salinity changes. At each station, A1-A14, a depth profile was taken as well as nutrient samples, chlorophyll and oxygen measurements. At 4 stations, a zooplankton sample was obtained. The conditions were optimal with cloud coverage ranging between 4-7 octants and calm waters.
![]()
The main aim was to collect data along a transect and investigate the biological, chemical and physical structure of the Tamar estuary from the pontoon and up to Calstock.
![]()
A zooplankton net (mesh: 200μm, diameter: 50cm) was deployed overboard to collect samples to be analysed. This occurred at 4 stations along the transect. A YSI 30 TIS probe (serial number 08E101997) was used to measure the temperature and salinity at the surface of each station. As the salinity changed by 2 ppt, a YSI 650 MDS probe (serial number 03H1580) was deployed to take a depth profile at each station – where temperature, salinity, pH and total dissolved salts were measured. At each station, the position of the station, the time and the cloud coverage were noted.
![]()
Whilst considering the data obtained through the use of the CTD, we were able to observe a trend in salinity and temperature as we moved from the riverine end of the estuary towards the mouth. Having started our data collection at the riverine end of the estuary at station A1, we found the water to have a very low salinity which gradually increased as we progressed towards the mouth of the estuary. This can be seen clearly on the graph of salinity and temperature against station number where the line of increase is almost constant (figure 12).
The surface temperature of the water also varies, however only by just under 1 ̊C. The lowest temperatures were found at the riverine end and the mouth of the estuary due to the cold influx of fresh and saline water in these areas, with the hottest water recorded in the middle. This is because the temperature was recorded here at the hottest time of the day, 13:00 – 14:00 UTC. Through the creation of salinity-temperature depth profiles, we were able to observe how the temperature decreased and salinity increased with depth.
The water at station A1 was highly stratified, the salinity almost doubled from 6.02 PSU at the surface to 11.31 PSU near seabed. Stratification decreased as we progressed down the estuary towards more saline water, with the final salinities varying by just over 2 PSU, from 30.52 at the top of the water column to 32.68 PSU at the bottom.
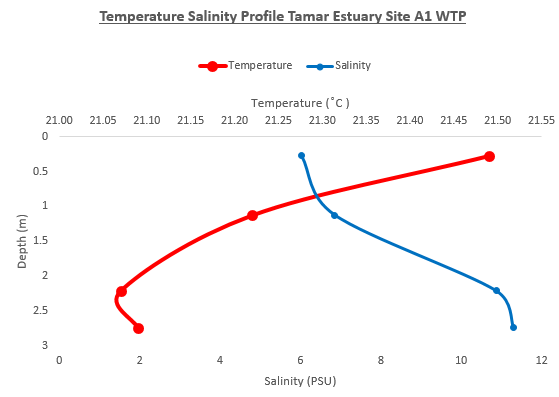 Figure 13: Temperature salinity profile for Site A1
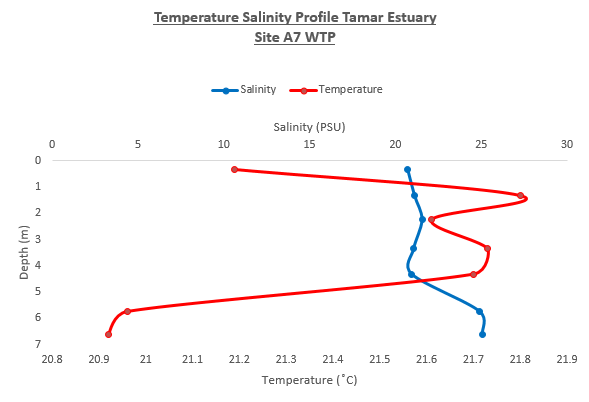 Figure 14: Temperature salinity profile for Site A2
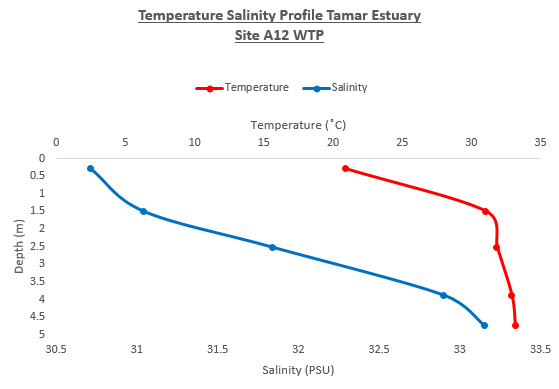 Figure 15:Temperature salinity profile for Site A12
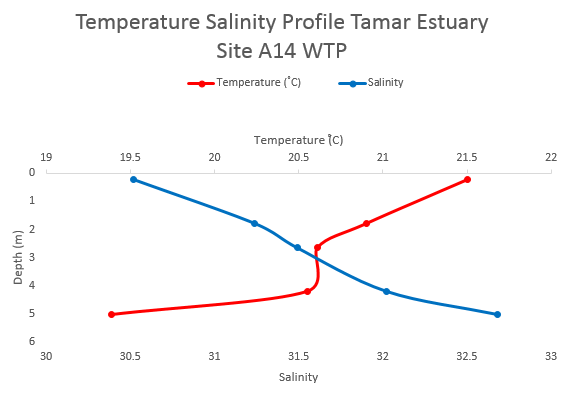 Figure 16: Temperature salinity profile for Site A14
Click arrows to view more graphs


PLYMOUTH FIELD COURSE: THE INITIAL FINDINGS OF GROUP 8