On the 5th of July, some members of the team were taken by the Falcon Spirit up and down the Tamar estuary, where they deployed the CTD rosette and Niskin bottles at nine different stations. The conditions were globally good, the weather was mostly sunny with a few small clouds.
![]()
To study the spatial variation in the vertical profile of the water column along the Tamar estuary; to identify phytoplankton and zooplankton species and appreciate their diversity and abundance at different stations along the estuary.
![]()
At each station, the CTD was deployed and water sampled at various depths. Water was then collected from the Niskin bottles and preserved in order to determine Oxygen, Chlorophyll and nutrient levels. A zooplankton drifting net was also deployed and towed along three different sections of the estuary. The content of the net was then collected in bottles and preserved with Lugols Iodine.
Temperature and Salinity Profiles
Surface water was warmer towards the top of the estuary, with a shallow thermocline 2 m deep at the first station upstream. Temperature then decreases as one goes down the estuary until the water column has a relatively uniform temperature of about 17 °C. Thus the temperature gradient between the stratified upper estuary and the lower estuary for the surface layers is about 4°C.
Salinity globally starts to decrease for the whole water column from station G as one goes upstream. A halocline starts to form towards the upper estuary while the bottom remains almost fully saline, between 34-35 psu. Globally, salinity along the estuary was never below 31 psu for the least saline points.
![]()
![]()
As Nitrate, Phosphate and Silicate concentrations fall below the TDL, nutrients are removed from the estuary and lost to various processes. Nitrate concentrations steadily decrease along the estuary. Phosphate concentrations are extremely low and relatively constant from 0 to 30 psu, then addition from 30 to 35 psu can be observed; Silicate levels remain low but constant along the estuary.
![]()
A striking spatial variability in phytoplankton species diversity and abundance could be observed along the estuary: No phytoplankton was detected at stations 12 and 17. A high number of cells was detected at station 11, where the Cletarala genus was by far dominant, and at station 18, where Coscinodiscus constituted the majority of the phytoplankton. Stations 13 to 16 had a lower cell number, and Guinardia was dominant at Station 13.
![]()
Stations F12, H11 and J19 were chosen as they represent different stages up the R. Tamar and its estuary leading into Plymouth sound. Data was logged on the 05/07/2018 from on the Falcon Spirit. No ADCP data was recorded in the upper estuary beyond the R. Tavy Confluence. Station F12 (Lat: 050˚22.377’N Long: 004˚11.336’W) near Torpoint ferry was logged from 09:14UTC to 09:17UTC. F12 represents the mid/ upper river and has a slower flow shown by the ADCP velocity contour. High tide was at 10:14AM and 4.54m so tidal flow was moving up the estuary at the time. The tide was also coming in during sampling at site H11 at 08:29UTC (Lat: 050˚21.813’N Long: 004˚10.354’W), near Cremyll, where the river mouth narrows before entering Plymouth Sound. The velocity contour shows an increase in flow velocity compared to Station F12. Station J19 (Lat: 050˚20.117’N Long: 004˚08.149’W) was logged from 13:23UTC-13:29UTC at the eastern breakwater. It is the nearest site to the open channel and shows the highest current velocity of the three sites on its velocity contour
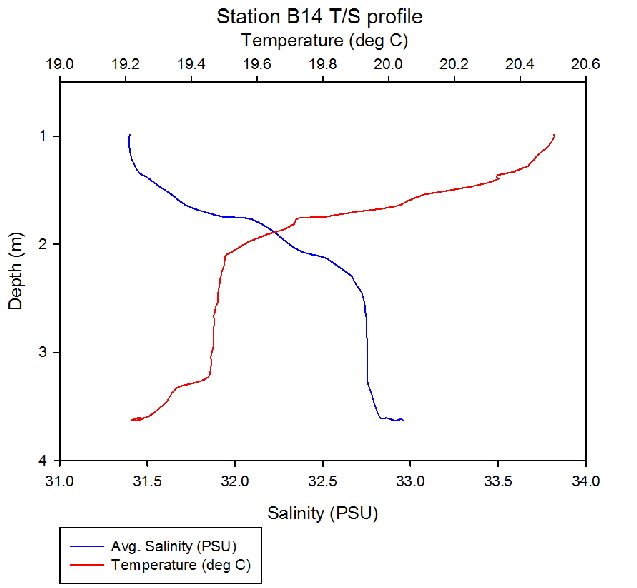 Figure 21: Temperature salinity profile station B14
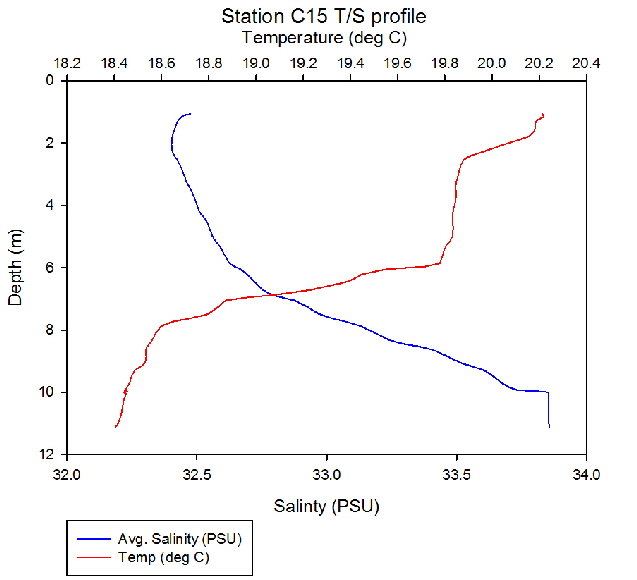 Figure 22: Temperature salinity profile station C15
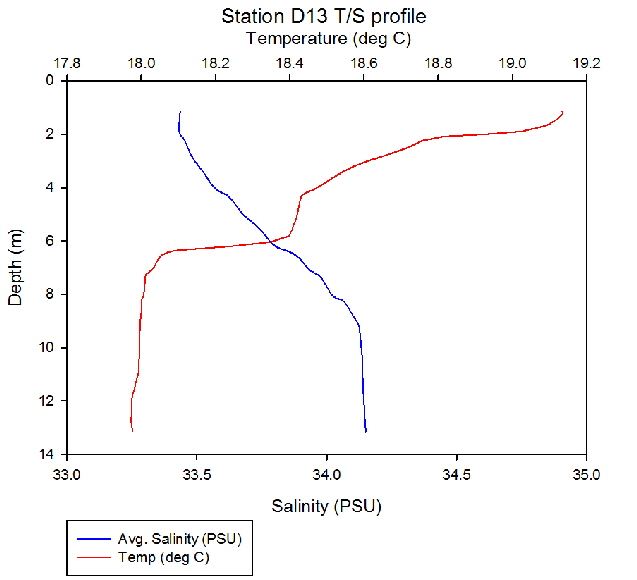 Figure 23: Temperature salinity profile station D13
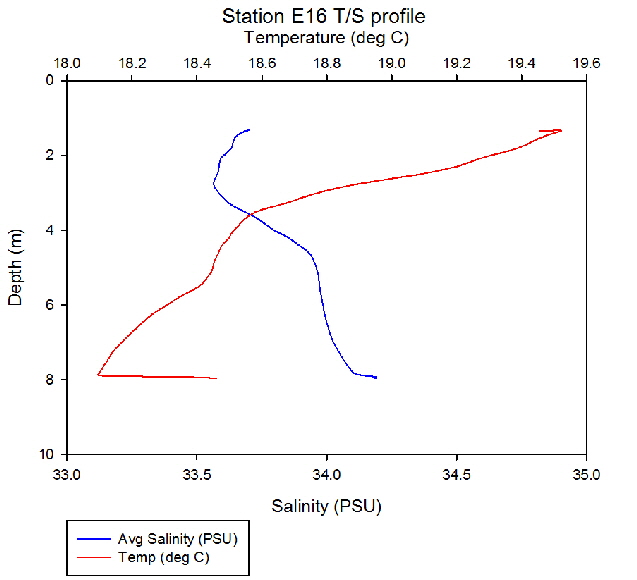 Figure 24: Temperature salinity profile station E16
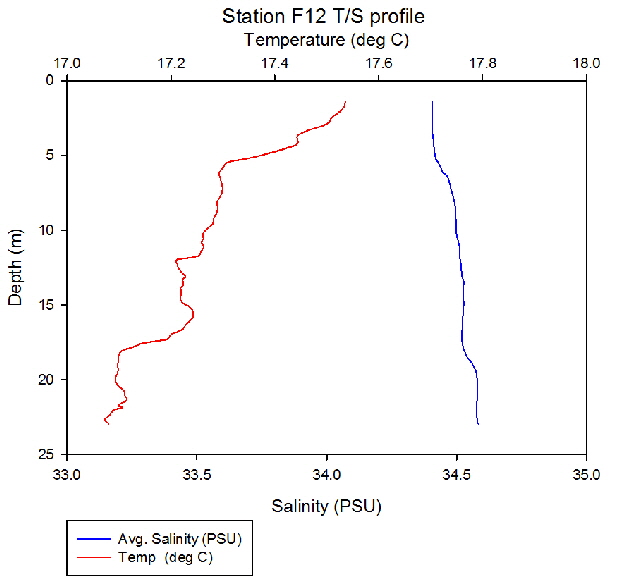 Figure 25: Temperature salinity profile station F12
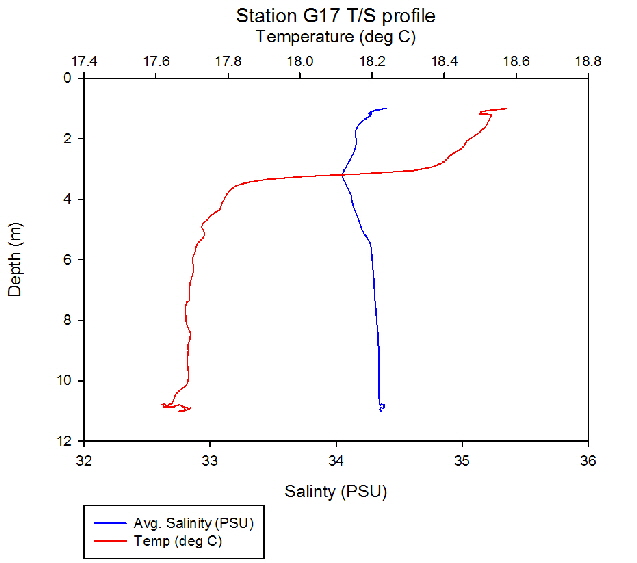 Figure 26: Temperature salinity profile station G17
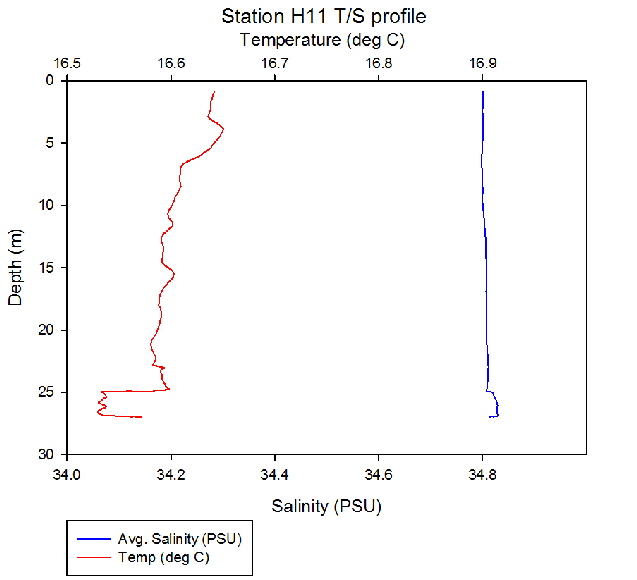 Figure 27: Temperature salinity profile station H11
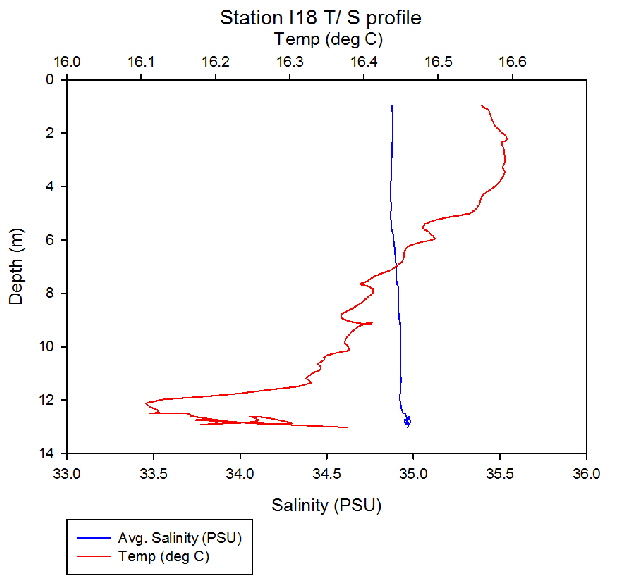 Figure 28: Temperature salinity profile station I18
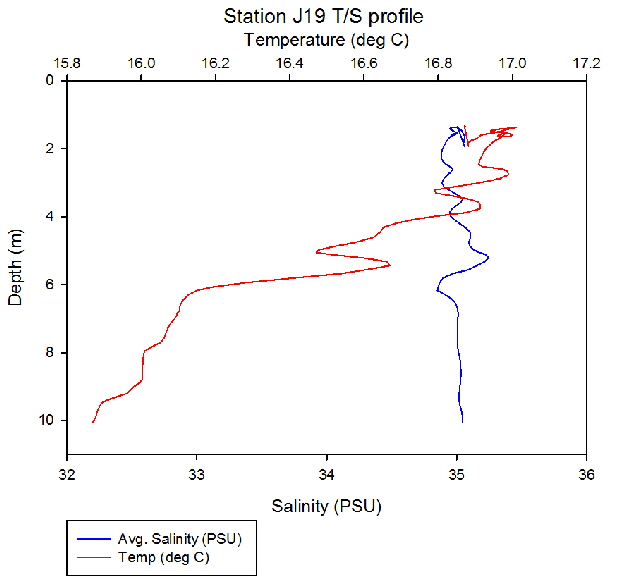 Figure 29: Temperature salinity profile station J19
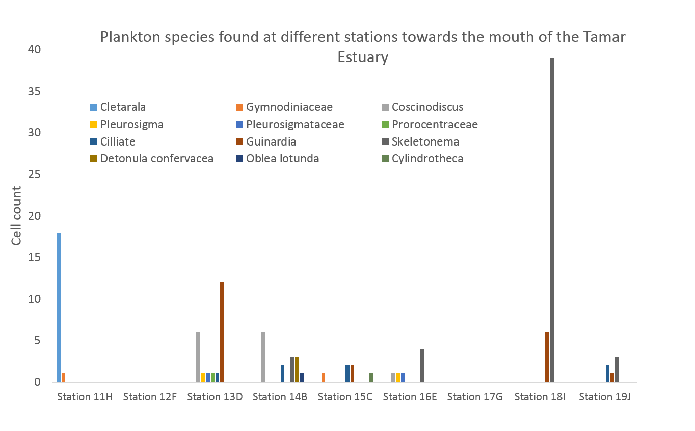 Figure 33: Phytoplankton diversity along estuary
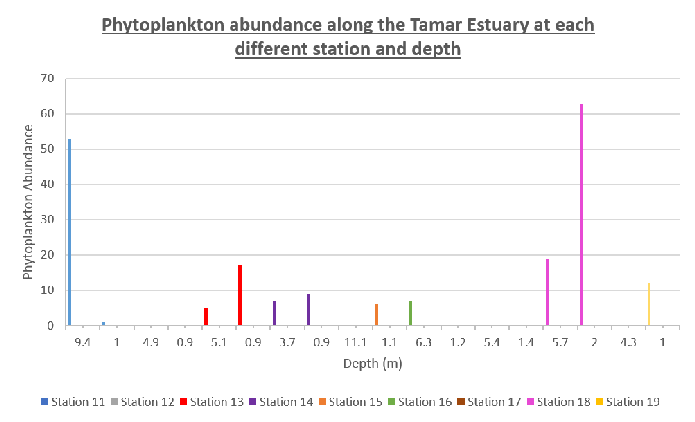 Figure 34: Phytoplankton abundance along estuary
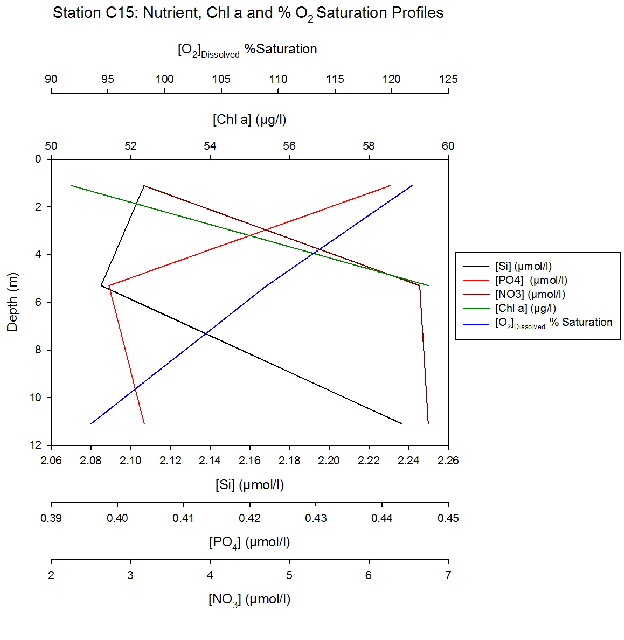 Figure 30: Nutrient, Chl a and %Oxygen saturation profile for station C15
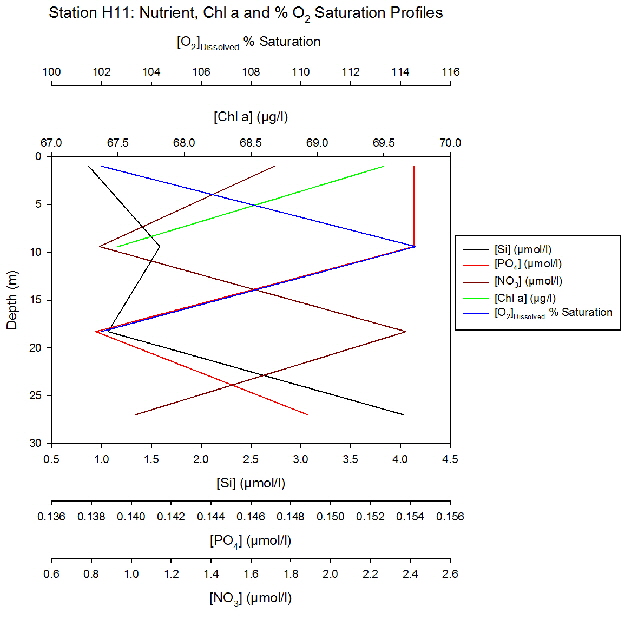 Figure 31: Nutrient, Chl a and %Oxygen saturation profile for station H11
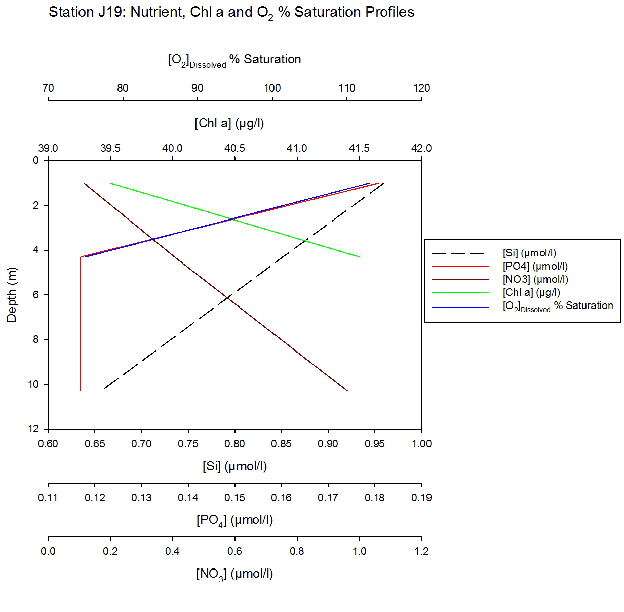 Figure 32: Nutrient, Chl a and %Oxygen saturation profile for station J19
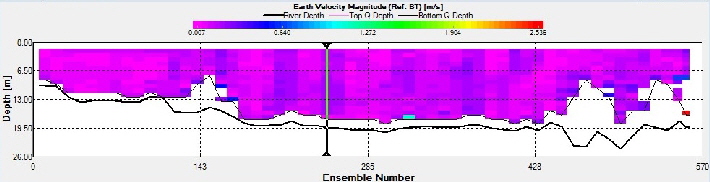 Figure 35: ADCP velocity magnitude F12
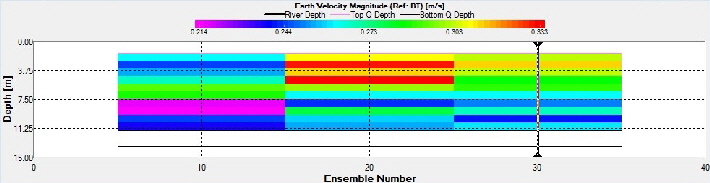 Figure 36: ADCP velocity magnitude H11
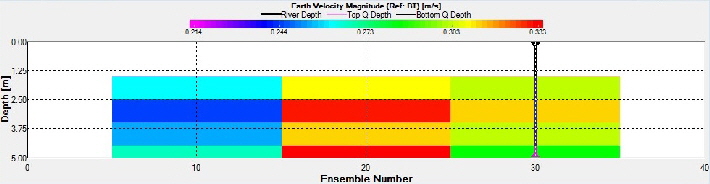 Figure 37: ADCP velocity magnitude J19


PLYMOUTH FIELD COURSE: THE INITIAL FINDINGS OF GROUP 8