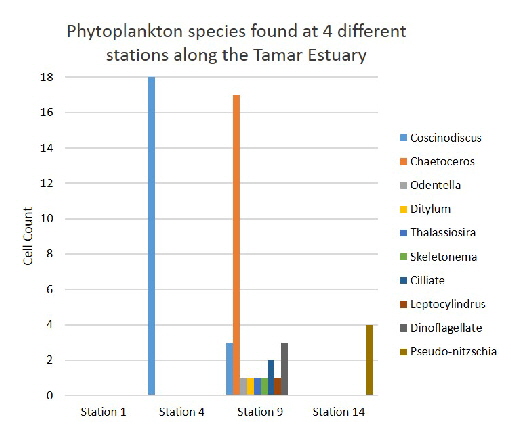
 Figure 5: Winnie The Pooh Phytoplankton abundance
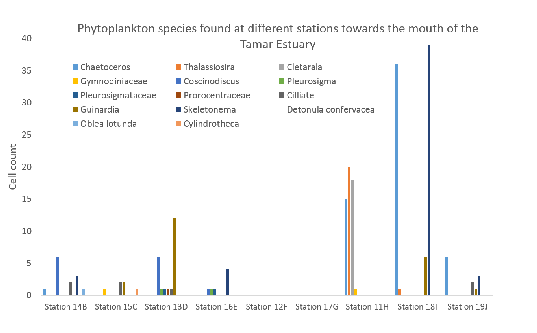 Figure 6: Falcon Spirit phytoplankton adundance
The Plymouth estuary formed from 3 different conjoining rivers, from the River Tamar, Lynher as well as the Tavy. It is a special area of conservation from the diversity and the abundance of life which lives along the river and estuary. As this river has a partially stratified mixing there would be a distinct halocline between the surface which would have a warmer less dense water and a colder denser water, generally creating a salinity range from 15-34 psu
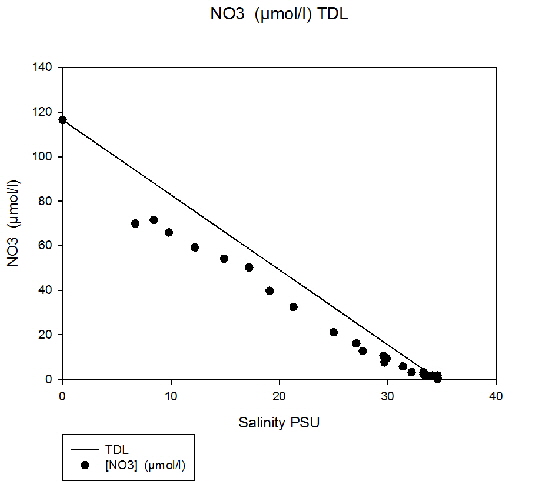 Figure 7: Nitrate TDL for estuary
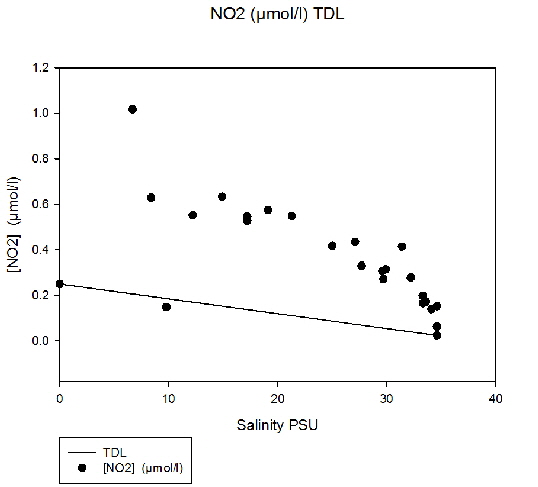 Figure 8:Nitrite TDL for estuary
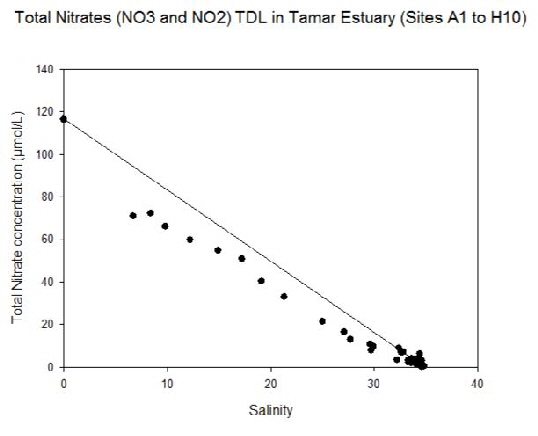 Figure 9: Total nitrates TDL for estuary
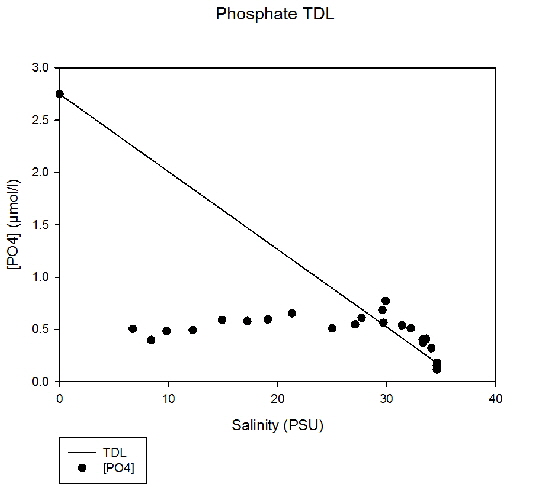 Figure 10: Phosphate TDL for estuary
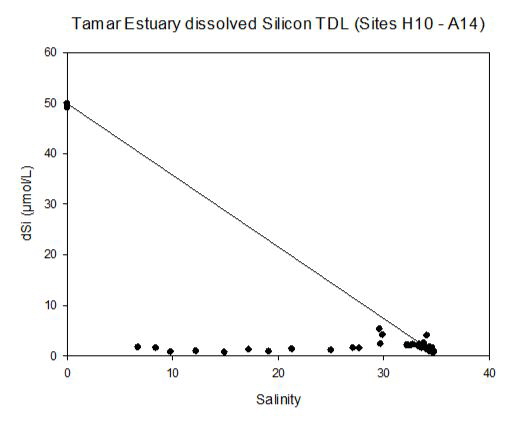 figure 11: Silicon TDL for estuary

Winnie The Pooh
Using the data collected from the Winnie The Pooh, Falcon Spirit and Pontoon it was possible to summarise the data in a way that showed the estuary as a whole system.
![]()
Using the data collected on Winnie the Pooh, we were able to analyse the number of phytoplankton found at 4 separate stations along the estuary. At Station 1, the most freshwater sample we found that there were no phytoplankton. At Station 4 where the salinity was higher, we found a very large abundance of Coscinodiscus but no other species were found in the sample showing a low diversity. At Station 9, we found the highest diversity with a total of 9 different species and the largest abundance of Chaetoceros. At station 14 we found only 1 type of species, this is Pseudo-nitzshia, this again had a very low diversity.
![]()
From analysing this graph, it is clear to see that the behaviour of total nitrates (NO2 and NO3) within the estuary is near conservative, this is represented by the data points which roughly follow the TDL, although there does appear to be a very slight negative deviation. There could be a number of explanations for this, however further analysis would need to take place in order to determine the true cause.
![]()
Nitrite displays strong non-conservative behaviour with all data points showing a positive deviation from the TDL except for one at a salinity of 10 PSU. Furthermore, the graph displaying the data for nitrate is very similar to that of the total nitrates, where the data points fall very close to the TDL. As only a fraction of the species of N in the estuary are in nitrite form, the non – conservative behaviour of nitrite is not visible in a plot of total nitrates.
![]()
Phosphate shows non-conservative behaviour with the majority of the data showing uniform concentrations of around 0.5 µmol per litre, however a point source of influx can be identified at a salinity of 30 PSU where the data points now lie above the TDL.
![]()
Silicon also demonstrates strong non-conservative behaviour with all samples above a salinity of 6 lying under by 10µmol per litre. A little spike in silicon concentration occurred at a salinity of 30 which is likely caused resuspension of sediment.

Click buttons to view Stations in more detail


Falcon Spirit

Pontoon
PLYMOUTH FIELD COURSE: THE INITIAL FINDINGS OF GROUP 8