Three members of the group stayed onshore at Saltash Pontoon on July 5th to conduct a time-series of different variables of the water column every half-hour throughout the day. Some were measured in situ while Chlorophyll levels would be analysed later in the lab thanks to the water samples collected. The conditions were adequate, with a mostly sunny and warm weather, no wind and a still water surface. Unfortunately, the light sensor was out of batteries all day and irradiance could not be measured.
![]()
To study the temporal variation of different parameters of the water column, such as depth, temperature, Salinity, current velocity and direction, and Chlorophyll levels.
Measures were taken at the surface, then for every one meter depth and finally at the riverbed. Temperature, salinity and oxygen levels were determined using TS probe. Depth was approximately measured using the length of cable deployed in the water.
A current meter was then deployed to measure tidal current velocity and direction.
Finally, a Niskin bottle was deployed and water filtered. Filters were then introduced in tubes containing acetones and stored, waiting to be analysed in the lab.
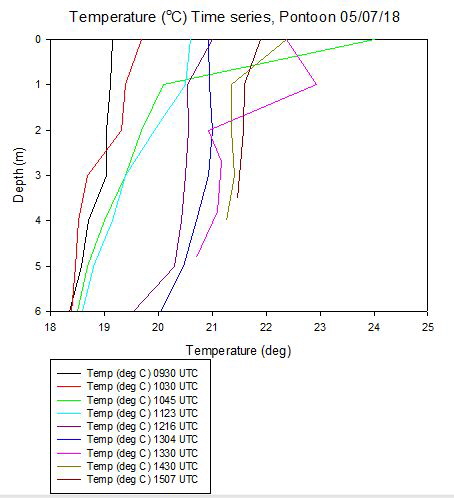 Figure 17: Pontoon temperature time series
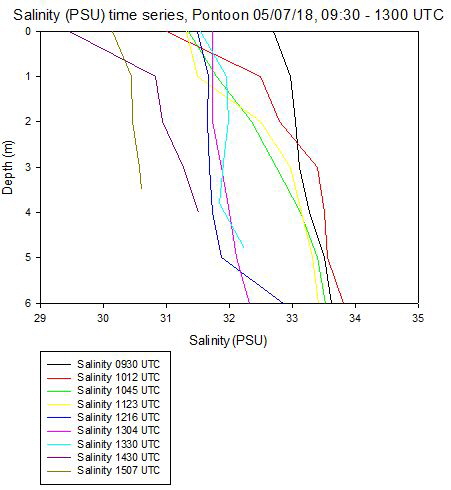 Figure 18: Pontoon salinity time series
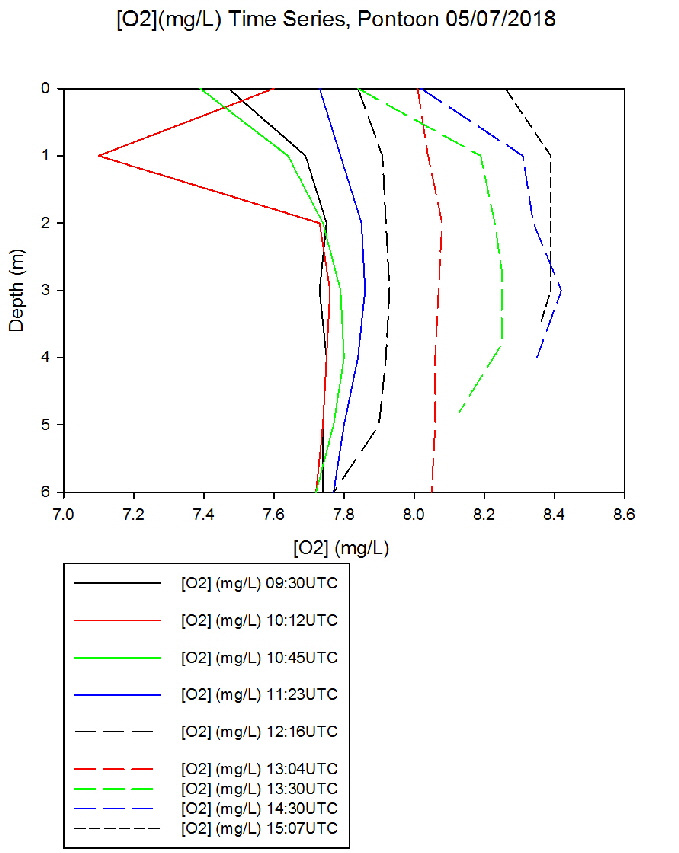 Figure 19: Pontoon oxygen timme series
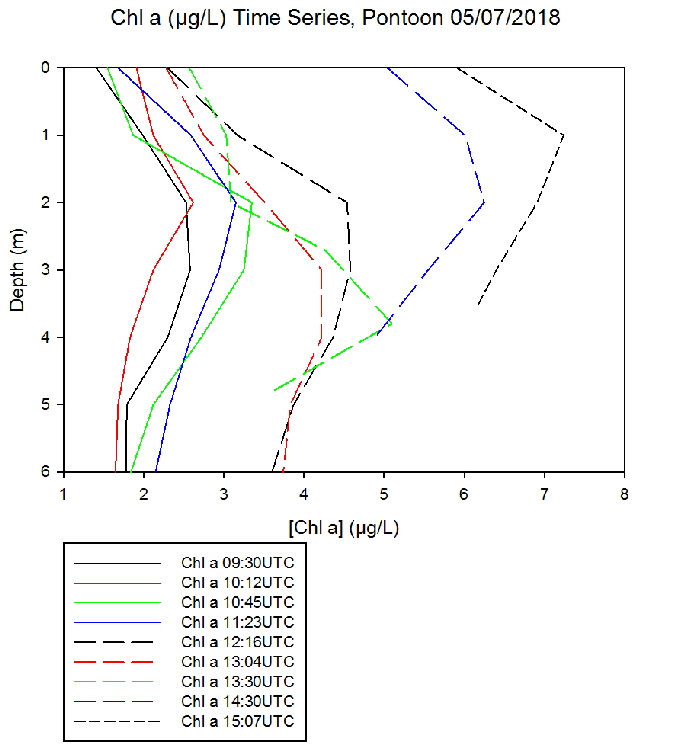 Figure 20: Pontoon Chlorophyll a time series
![]()
The data showed a clear change in conditions with time in the pontoon across the day. On figure 17 the maximum temperature shows to increase throughout the day. With the lowest temperature being 17°C at 930 UTC then the highest being 24°C at 1045 UTC, and the average maximum temper increasing along with time. Although there would be a maximum temperature increase there would be a decrease in the range of depth as well as the range of temperature as the day progresses, as shown from the lines ranging from 1216 to 1507 UTC. This would occur as the high tide on 05/07/18 was from 0956 UTC whilst the low tide would have occurred during 1550 UTC so there would be a gradual decrease of depth.
Figure 18 on the other hand shows an inversed pattern in comparison to the temperature as throughout the day there would be a decrease of salinity, with the 0930 UTC having a value of 33 PSU and the 1430 UTC having a value of 29 PSU. Although these are the minimum and maximum the greatest range occurs between 1012 UTC and 1123 UTC changing 2PSU from the surface and the bottom water in average.
The oxygen time series on the pontoon shows an increase in the concentration as the day progresses, ranging form 7.1mg/L in 1012 UTC to a maximum of 8.4mg/L in 1430 UTC. Further on as the depth increases there also shows to be a slight decrease of concentration right at the bottom, due to there being a lesser phytoplankton amount shown in figure 3.
Chlorophyll data shows a similar trend to the oxygen data as there would be an increase in chlorophyll with the oxygen concentration. At the surface there shows to be a less amount ranging from 1.5µg/L at 9:30 UTC to 6µg/L 15:07 UTC. But the greatest difference occurs, during the peaks amounts. As the peak before 1230UTC would be 4.5µg/L whilst the minimum for the vales 1430 UTC onwards are higher than that maximum with 5 µg/L. The peak differs with depth as well, decreasing as it gets later on in the day shown in figure 4.


PLYMOUTH FIELD COURSE: THE INITIAL FINDINGS OF GROUP 8