DISCLAIMER: These opinions and views are those of the individuals concerned and not
those of the University of Southampton.


Figure 1: Salinity Profiles
Click Thumbnail for expanded view and description:
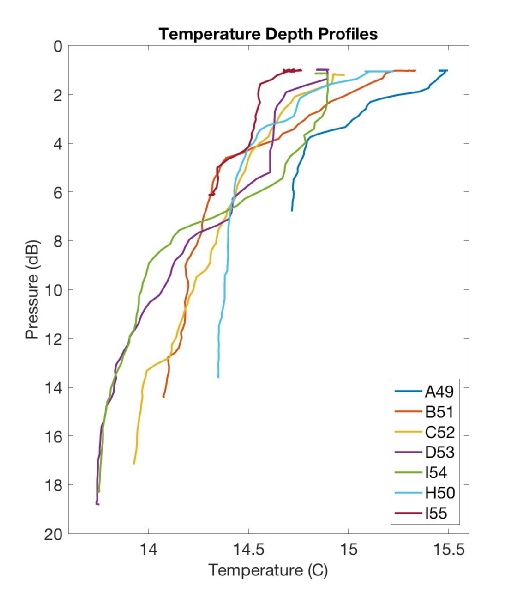
Figure 2: Temperature Profiles
Figure 3 : Transmission Profiles
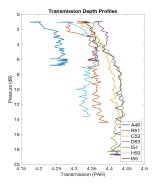
Figure 4, 5 : Zooplankton Community
Click expand button ( bottom right) to see figure and description
Figure 6,7 : Phytoplankton Community
Figure 8,9: ADCP Cross Sections
Figure 10,11,12: Chemical Results on TDL Graphs
End members were taken from two different rivers, River Allen and River Kenwyn as
well as an end member where these two rivers converge forming the River Truro. These
end members show a salinity of 0 PSU.
Discussion and Conclusion