DISCLAIMER: These opinions and views are those of the individuals concerned and not those of the University of Southampton.

TEMPORAL PONTOON SURVEY:
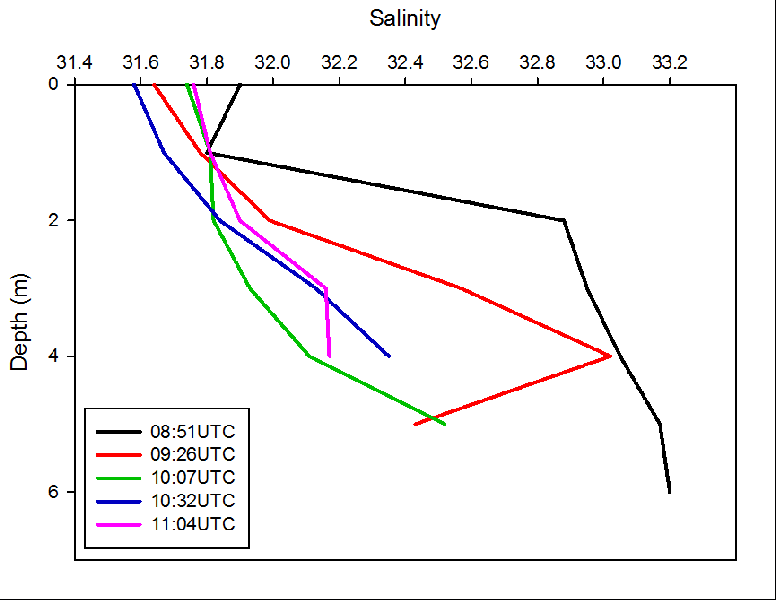
EXO-
Results:
← EXO-
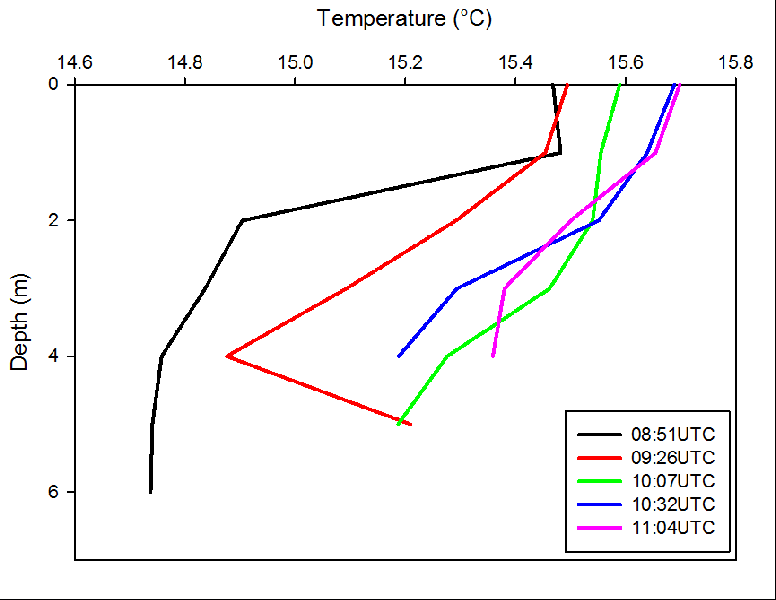
EXO-
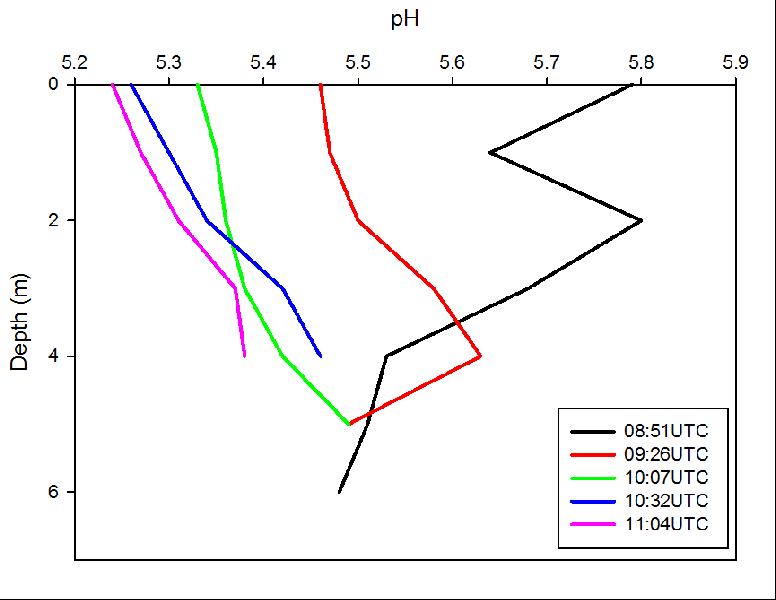
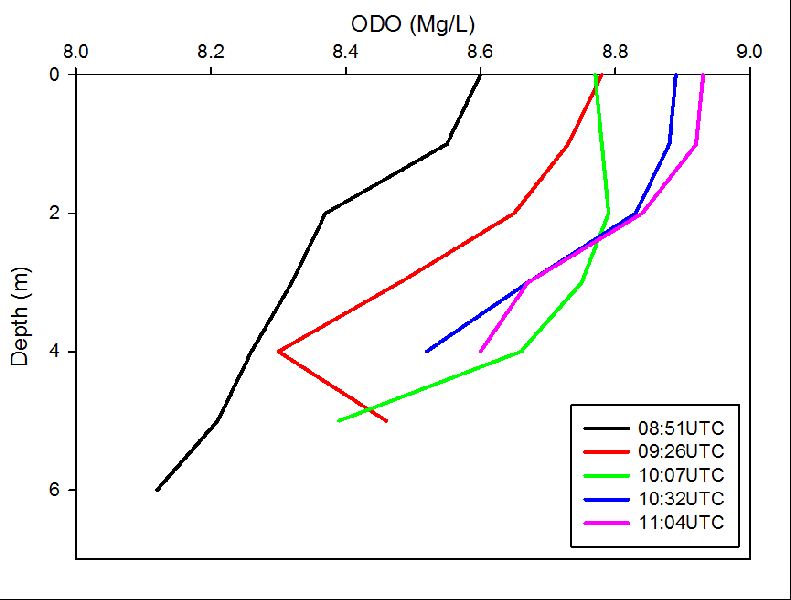
← EXO-
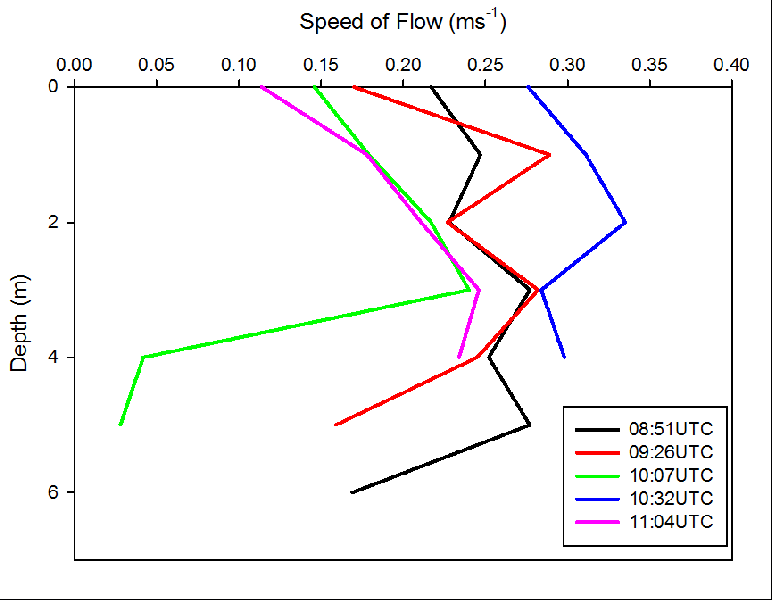
Flow Meter : Flow depth profile →
← Light Meter : Irradiance depth profile
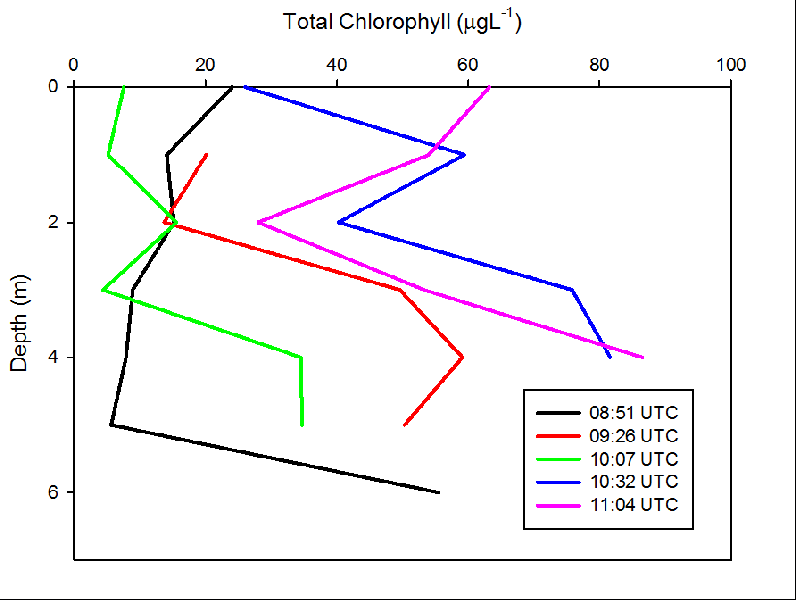
Fluorometer : Fluorescence depth profile →
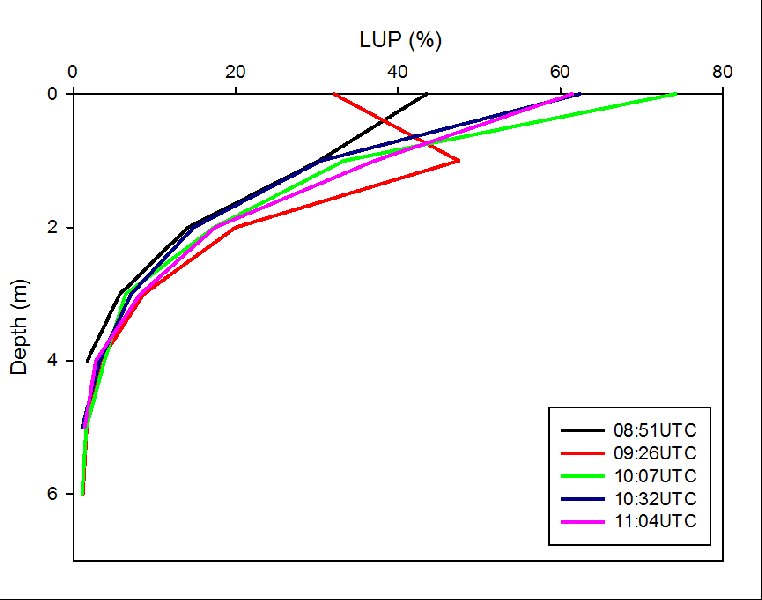
← Light utilised by photosynthesis (LUP) against Chlorophyll
 (1104).PNG)
Total Chlorophyll against Oxygen Concentration →
.PNG)
Figure 1
Figure 2
Figure 3
Figure 4
Figure 5
Figure 6
Figure 7
Figure 8
Figure 9
The results of the Exo-
The results of the flow meter show that the flow (ms-
The results of the light sensors show that light (LUP %) decreases exponentially as depth increases, with a decrease of up to 55% observed in the first 2 metres.
The results of the fluorescence data show that the chlorophyll concentration (µgL-
Click Thumbnail for expanded view and description:
| Results and Discussion |
| Results |
| Discussion and Conclusion |
| Results |
| Discussion and Conclusion |
| Results |
| Discussion and Conclusion |
| Methodology Continued .. |