DISCLAIMER: These opinions and views are those of the individuals concerned and not those of the University of Southampton.

 Results
Discussion and Conclusion
Results
Discussion and Conclusion
Introduction:
From the data we hoped to determine estuary classification as defined by water mixing and flow. Also of interest: riverine and terrigenous inputs of major nutrients, how they behave in the estuary and the effect of plankton on nutrient levels and freshwater nutrient input to the ocean.
Methodology:
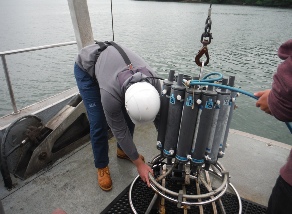
CTD Deployment
Set the Niskin bottles ready to fire and switch on the CTD. Begin to deploy the CTD
when the dry-
THE FAL ESTUARY SURVEY:
Plankton Net
Deploy the 200 micron mesh zooplankton net with 4-
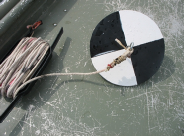
Secchi Disk
Deploy the Secchi disk and continue to lower it until it is no longer visible. Retrieve the Secchi disk back on deck and measure the length of cable, taking into account the height of the boat (90cm) and the length of cable between the disk and first mark on the cable (52cm).
Hover over image for description:
Abstract:
The aim of the Fal estuary survey was to ascertain its chemical, biological
and physical properties during the transition from fresh river water to water of
increased salinity. As the salinity of the estuary increased the concentration of
silicate, nitrate and phosphate all decrease, suggesting removal behaviour. Populations
of zooplankton are greatest the further from the mouth of the estuary conversely
populations of phytoplankton are lowest in this area due to consumption by zooplankton.
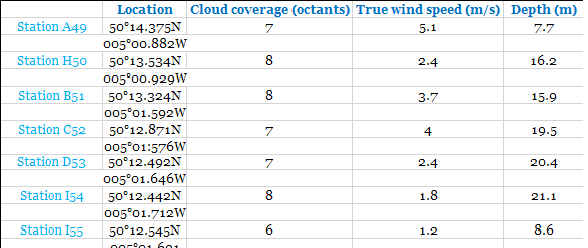
Station Locations -
| Results and Discussion |
| Results |
| Discussion and Conclusion |
| Results |
| Discussion and Conclusion |
| Results |
| Discussion and Conclusion |
| Methodology Continued .. |