
Group 8 - Falmouth 2015
Habitat Mapping
The geophysical survey took place on the 27th of June 2015 on The Xplorer. Five transects were completed around the coast from zone point offshore from Porthbeor beach (approximate coordinates 50’08.6N, 4’59.6W). This area was chosen due to its positioning past the Special Area of Conservation (SAC), which is allocated to a large percentage of Falmouth bay. The reasoning behind this was to find out whether or not there is a difference in biodiversity between protected areas and non-protected areas. Group 8’s study continued transects initiated by group 11, and the combined results of these will be compared to the findings of group 4 which surveyed just around the same headland but inside the SAC
Biodiversity is defined as the “variability among living organisms from all sources including inter alia, terrestrial, marine and other aquatic ecosystems and the ecological complexes of which they are part; this includes diversity within species, between species and of ecosystems” (UN Conference on Environment and Development, 1992).
The side scan sonar was used to produce a habitat map of the seabed, it identified areas of both sandy and rocky substrate. Three videos of the seabed were filmed within our transect areas and analysed to determine whether there was a difference in the biodiversity and species richness of the two different substratum types. These two videos were then further compared to videos made by group 4 who ‘s transects were not within the SAC to see if there is a difference between the biodiversity in a SAC and non-SAC zone.
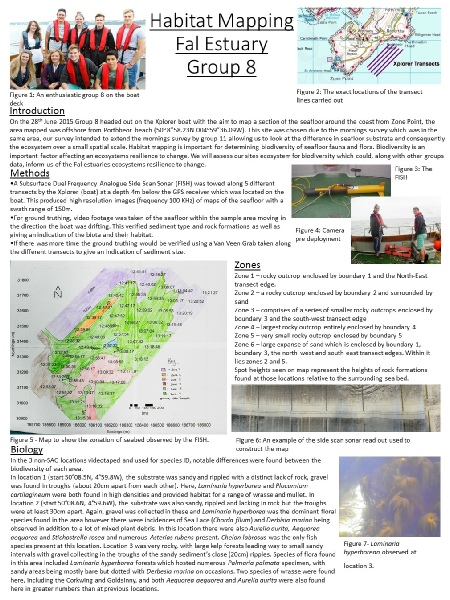
Below is a poster made by us, Group 8, to show the initial findings from our Habitat
Mapping survey and subsequent lab session.
PDF LINK FOR POSTER
Conclusions and Comparisons
In the 3 non- SAC locations videotaped and used for species ID, notable differences were found between the biodiversity of each area.
Group 11 sampled a non-SAC region to the south east of the site studied by group 8, continuing the transect closer to zone point. Here the substrate was fairly homogeneous, made up of exposed bedrock. Some patches of sandy substrate were found towards the edge of the site, particularly in the northwest region. In contrast the site sampled by group 8 was predominantly a soft sandy habitat, with occasional rocky zones. These rocky patches vary from large outcrops of exposed bedrock, to small rock outcrops partially covered by sand. They found an abundant presence of Laminaria Digitalis, as well as Aurelia aurita. Occuring in lower densities were Electra pilosa and Membranipora membranacea, as well as Pollachius pollachius and Labrus mixtus.
Group 4 took video footage of 3 different transects within a SAC location north-west of sites studied by groups 4 and 8, just north of Zone Point within Falmouth bay. They found that the seabed was primarily sandy and muddy, with occasional ripple marks covered in algae and areas of rock colonised by Laminaria, Saccorhiza and Heterosiphonia species. The presence of pits and burrows indicated the presences of infaunal worms, crustaceans and more. They observed an abundance of Zostera marina in the first two of their transects and within these they found species such as Gobias couchi (which is protected (JNCC, 2014) and Pollachius pollachius.
As a result of these findings it is possible to conclude that may be a small degree of difference in biodiversity between the Special Area of Conservation and non-SAC areas. Gobius couchi is a protected species and was found in the SAC area (JNCC, 2014) sampled by group 4. There were however zero protected species observed on the non-SAC video transects. This is not conclusive that there are not any protected species present in the area at all, but it is a good indicator that there is a difference between the levels of biodiversity between the two.
Counteracting this however is the fact that there was a higher number of species observed in the non-SAC area; a total of 17 different species were found in the non-SAC areas, whilst only 6 were found in the SAC area, although this is most probably just a result of a greater period of video being analysed for non-SAC areas. We expect that the longer the period of video analysed the more species you would expect to see because the area viewed is larger.
Disclaimer; the views and opinions expressed are those of the individuals in Group 8 and not necessarily those of the University. ©El Sharkke 2015
FIGURE 1 (above); Adrian and Leanna ready to deploy the camera on Xplorer.
FIGURE
2 (below); Katherine and Hattan working in the lab on the habitat map.
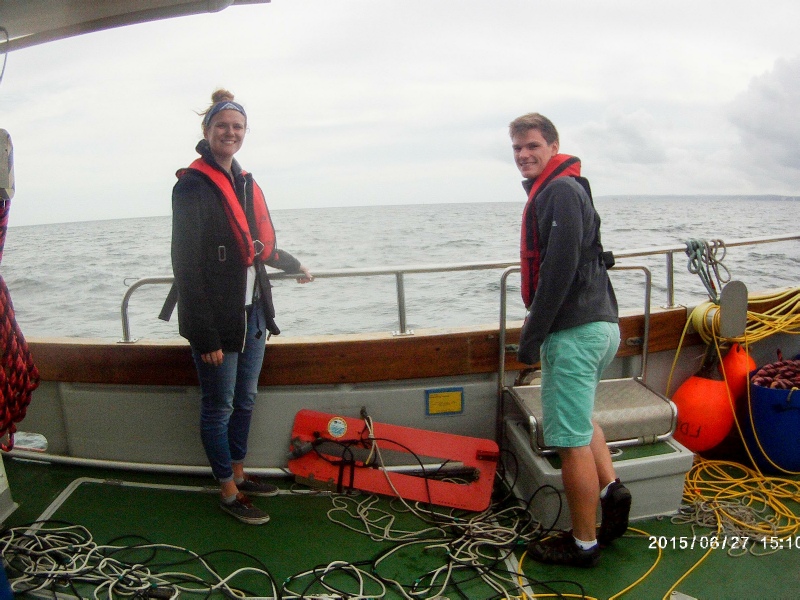

FIGURE 3; poster showing the initial findings from the geophysical survey, with habitat map inserted.