
Group 8 - Falmouth 2015
Pontoon
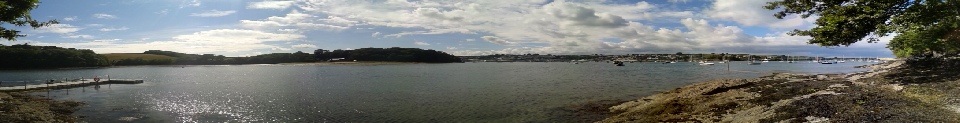
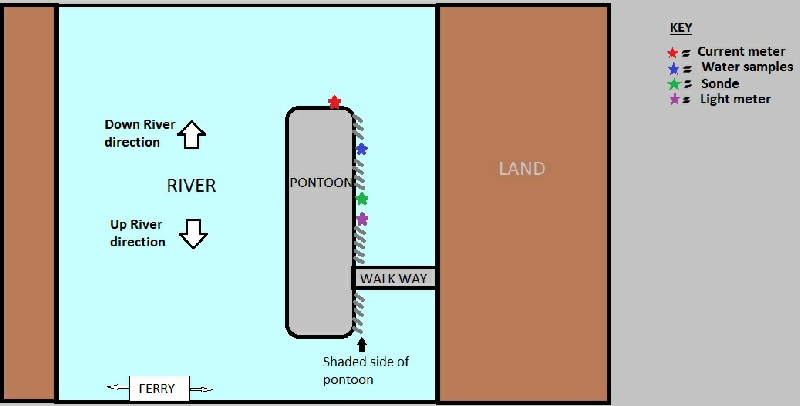
The pontoon used for this data collection was situated around mid-way up the Fal estuary, on the western bank of the Fal river near Trelissick at 50° 12'58.0N, 005° 01'39.5W. Various methods were used to obtain a range of measurements from this location including chlorophyll, light attenuation, temperature, salinity, pH, dissolved oxygen, turbidity, depth and current flow. Other conditions such as cloud cover and total depth were also noted at this location in the log book. Cloud cover and weather conditions during the morning changed considerably; when we arrived sampling took place between 8:30 (UTC) and 11:30 (UTC), with measurements being noted every 30 minutes throughout. Figure 3 (below left) shows the positioning of each station in relation to the pontoon and figure 4 (below right) shows the pontoons position on the river.
The multi-parameter sonde was used to obtain pH readings. Much like the temperature and salinity data collection, readings were taken for the water column once every half an hour for three hours.
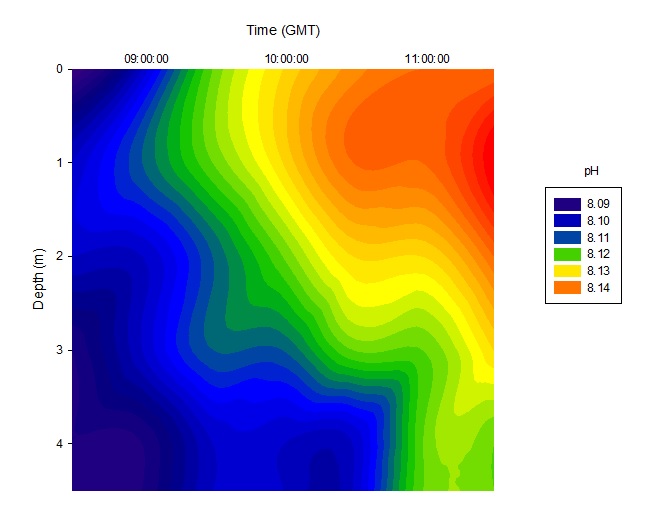
FIGURE 7; A contour graph showing the changes in pH with depth over time.
Figure 6 shows that pH does not change considerably over the 3 hours of data collection at any depth. The largest change in pH over the 3 hours occurs at a depth of 1m where the pH changed by approximately . The smallest change in . The graph shows that the lower salinity river water (refer to figure 5) on the surface as the more acidic water mass. As the tide goes out (high tide at 09.27 GMT) the acidity of the water column increases as the
FIGURE 10; contour graph to show the effect of depth on dissolved oxygen levels within the water column at the pontoon throughout the course of the morning.
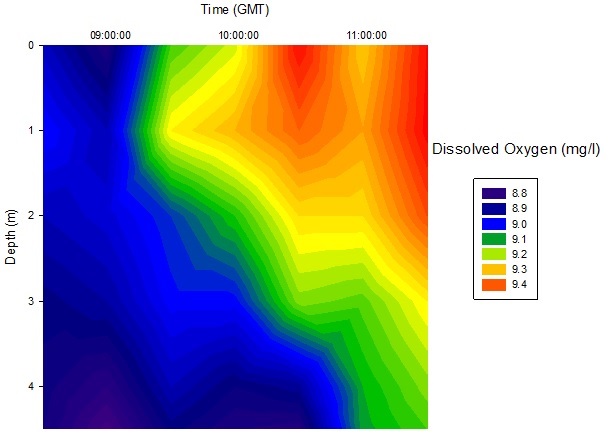
The graph shows that the dissolved oxygen in the water column is increasing with time and decreasing with depth. The largest change in concentration over the sampling period, 0.5 mg/L, occurred at the surface where the concentration was approximately 8.9 mg/L at 8:30 GMT and increased to 9.4 mg/L at 11:30. At the bottom of the water column the change in concentration was smaller, approximately 0.4 mg/L over the three hour sampling period.
Possible explanations…
Richardson Number
The Richardson Number was calculated using salinity, temperature and depth from the CTD data to calculate density and the ADCP data to give current velocity with depth. The Richardson Number gives an indication of the type of flow and the subsequent mixing as a result. If Ri is >1 flow is laminar, <0.25 flow is turbulent, and 0.25-1 it is transitional between the two types of flow.
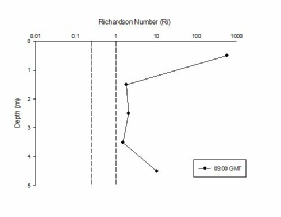
FIGURE 10; line graph showing the Richardson number with depth. Vertical lines show
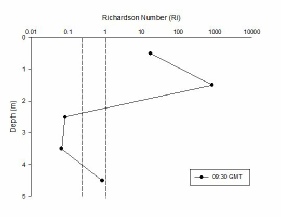
FIGURE 11; line graph showing the Richardson number with depth. Vertical lines show
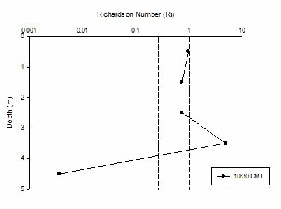
FIGURE 12;
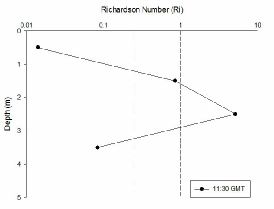
FIGURE 13;
Figure 10 (9:00 GMT) shows laminar flow across all depths (0-5m) with increasing turbidity with depth, followed by an increase in the Richardson Number at the lowest depths. At 9:30 GMT (figure 11) flow remains laminar in the surface with turbulent flow and subsequent mixing at depth (2-4m). Flow then becomes transitional at the deepest point (4-5m). High tide is at 9:20 GMT and may account for a lack of turbulence and mixing observed in figures 10 and 11. An hour later (10:30 GMT – figure 12) flow with depth is transitional (0-3m) and laminar (3-4m) except at depth where there is very high turbulence. This is due to higher salinity at bottom depths and turbulent mixing of the bed. Mixing increases at 11:30 GMT (figure 13) with turbulent flow at 0-1m and 3-4m. Flow is both transitional and laminar from 1-3m and could be a result of a reduced halocline and the consequent mixing between the river and sea layers.
The current meter was used to collect data on the flow patterns in the estuary. Readings were taken at 3 depths.The exact position of the current meter is shown on figure 3.
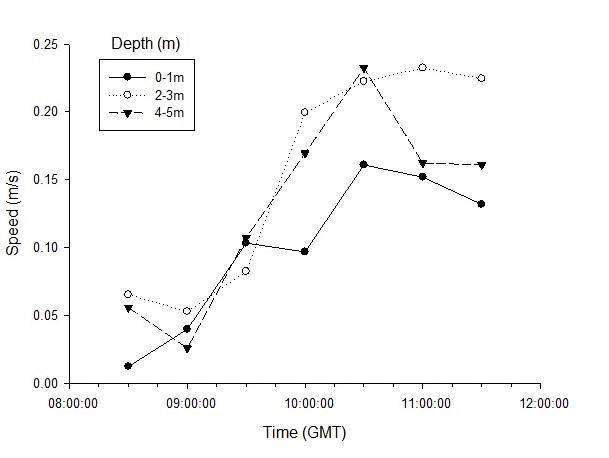
FIGURE 8; graph to show the change in speed (m/s) of current flow at various depths from the hours 8.30am until 11.30am GMT.
Figure * shows that at earlier times the current speed is minimal at just 0.0125 m/s, 0.07 m/s and 0.06 m/s at 8.30am GMT for depths 0-1m, 2-3m and 4-5m respectively. Both depths 0-1m and 4-5m decrease by 9am, but the intermediate depth 2-3m increases at this point in time. All stations then increase dramatically at 9.30am, and both depths 2-3m and 4-5m continue this trend at 10am, yet 0-1m slows down slightly. All depths then increase again at 10.30am with both 2-3m and 4-5m reaching their peaks before decreasing at 11am and levelling off by 11.30am. 0-1m however reaches its peak at 11am and then levels off at 11.30am.
Chlorophyll and Turbidity
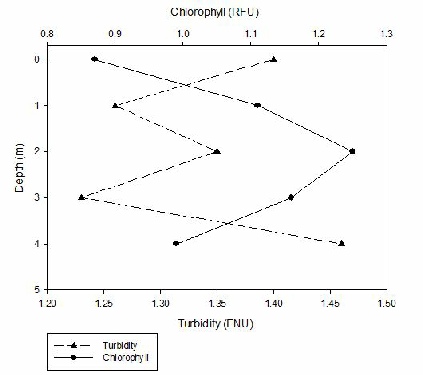
Figure X shows the link between turbidity and chlorophyll. At the surface (0-2m) chlorophyll levels are low but turbidity is high, and then chlorophyll levels are high but turbidity is low suggesting that phytoplankton is not the cause of the turbidity. Instead it is probably due to terrestrial surface runoff. After this however (1-3 metres) turbidity then starts to increase again, as does chlorophyll; the two appear to be linked until 3 metres depth. This suggests that the turbidity may be a result of increased chlorophyll contained within phytoplankton and other organic matter.
FIGURE *; line graph showing the . The chlorophyll data came from the sonde data
Disclaimer; the views and opinions expressed are those of the individual and not necessarily those of the University. ©El Sharkke 2015

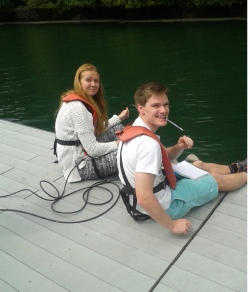
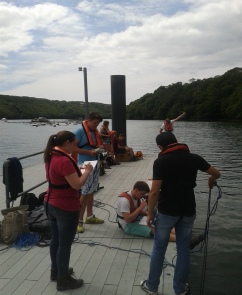
FIGURE 1 (left); group 8 completing the data collection on the pontoon.
FIGURE 2 (right);
Adrian and Leanna on the pontoon using the Sonde.
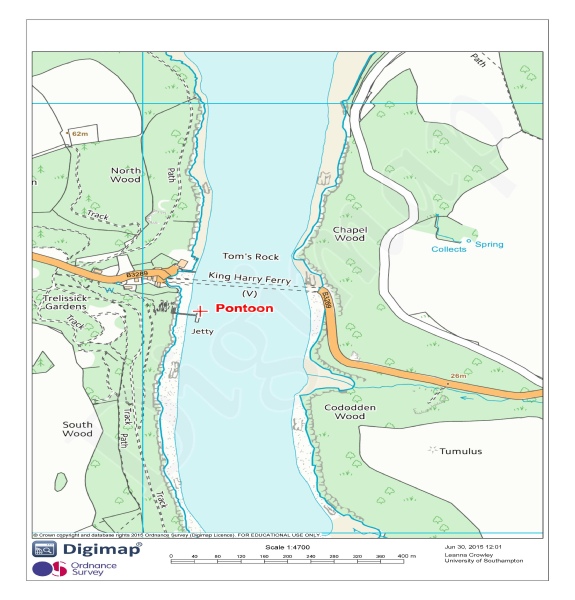
FIGURE 3 (left); map showing the positions of the stations used to sample the water
column.
FIGURE 4 (right); map showing the position of the pontoon in relation to
the Fal river.
A weighted and marked line was used to measure the depth of the estuary. This method
of measuring depth is not that reliable at high current speeds due to the line often
being dragged by the current and not sitting perfectly straight in the water column,
meaning that the distance measured is often too long. Current speeds during the morning
were relatively slow however and the line was weighted well so the depths can be
regarded as reasonably accurate.
Depth only varied by 0.25m in the 3 hours of sampling.
The depth of the water column was 5m when we arrived and the depth changed to 4.75m
at 10:30 GMT.
Temperature and salinity were measured by a multi-parameter Sonde at differing depths according to the total depth of the water column at the pontoon (exact location of Sonde detailed in figure 3). Measurements were taken once every half an hour for a period of 3 hours; the data collected is shown below in contour graphs (figures 5 and 6).
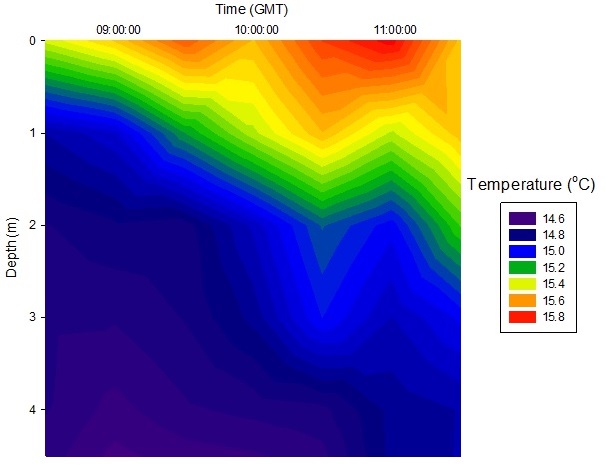
FIGURE 5; A contour graph showing the changes in water temperature with depth over time.
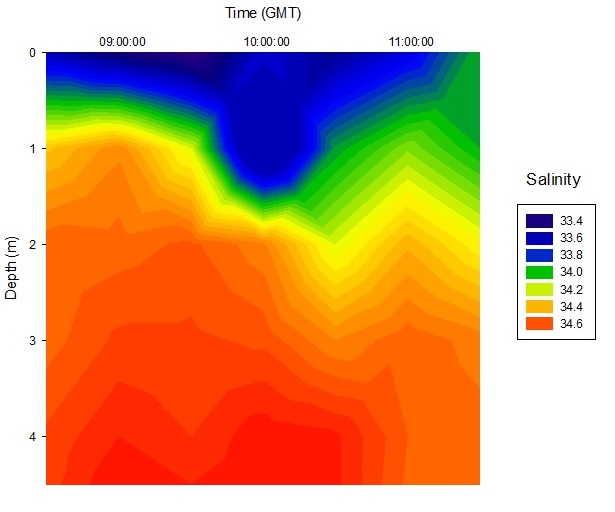
FIGURE 6; A contour graph showing the changes in salinity with depth over time.
Figure 5 is a contour graph showing the changes in the temperature of the water mass throughout the morning. Predictably, temperature increases throughout the day as the water column is warmed by the sun. There is a colder layer sitting beneath the warmer layer with a pronounced thermocline between the two water masses. As time increases and the surface water is heated further and the thermocline migrates deeper within the water column but still remains visible and abrupt throughout.
It is clear from figure 6 that there are two bodies of water within the estuary. The top half meter of the estuary has a salinity of approximately 1.1 units less than the underlying water. The top fresher layer is due to the riverine input, it sits above the saltier ocean water because it is less dense. The stratification of the water column shows a lack of mixing, this allows a halocline to form at approximately 0.75m. At around 10:00 GMT there is a noticeable increase in the depth of the halocline. High tide occurred at 09.27 GMT therefore at this time there was little or no tidal movement in the estuary at this time however there is still an influx of fresh water. Past 11:00 GMT there is a destruction of the abrupt halocline, the water column becomes less stratified and it is no longer clearly two separate water masses. We predict that the deepening of the surface layer may be due to increase in riverine input from the
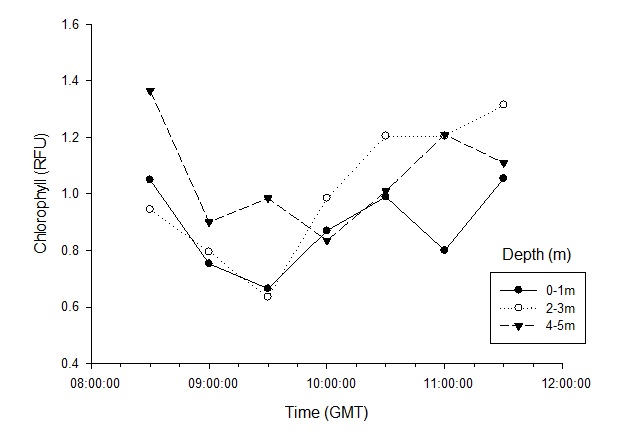
FIGURE 5; Chlorophyll vs. Time graph showing changes in chorophyll at different depths over the 3 hour sampling period. The plots show the average chlorophyll reading over the depth range as labelled. Graph including 3 plots allows comparison of chlorophyll through the water column.
Two different methods were used to collect information on chlorophyll presence within the water column at the pontoon throughout the field trip by other groups however due to human error, lack of equipment (syringes) led to the omission of the manual acetone method from this series of samples. Instead, chlorophyll was measured solely via the YSI probe in units of µg/L and relative fluorescence units. The µg/L readings were not used for further analysis due to high fluctuation of readings on the day.
Figure 5 shows that Chlorophyll starts off at 8.30am being most abundant at 4-5m depth, and the total amount of chlorophyll present in the whole water column was around 3.45 RFU. For all stations the amount present at any depth decreases sharply by 9am. The surface depths (0-3m) continue decreasing until 9.30am, but 4-5m depth sees an increase in chlorophyll at the same time although the total combined chlorophyll reaches a minimum here, at 2.25 RFU. At the surface levels (0-3m) chlorophyll increases again at 10am, but the deepest level (4-5m) counteracts this and decreases to 0.85 RFU. At 10.30am all depths increase, with the intermediate depth having the highest levels of chlorophyll at 1.25 RFU. The levels for both 0-1m and 4-5m depth are very similar at this time at around 1.0 RFU. By 11am 2-3m depth and 4-5m depth become have similar amounts of chlorophyll present at 1.2 RFU, but the uppermost depth (0-1m) decreases dramatically to 0.8 RFU. At the final sampling time (11.30am) the combined chlorophyll levels increase to their highest level at 3.45 RFU.
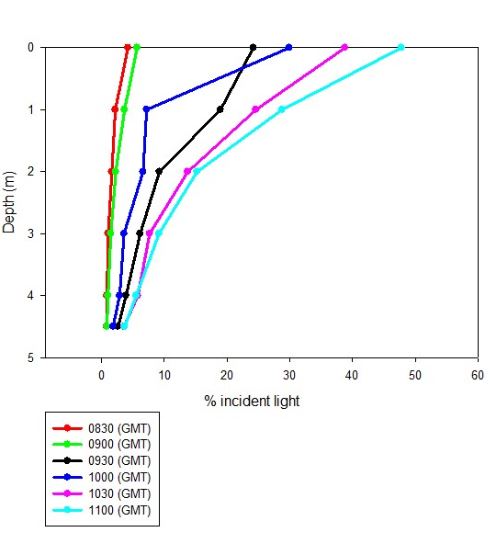
FIGURE 9; % incident light vs. Depth graph showing the attenuation of light through the water column. Different plots show the attenuation curve at different times.
Light Attenuation
The amount of iridescence present was calculated via the use of a light meter, which observed the levels of which at the surface in addition to differing depths depending on the total depth of the water which changed with the tides throughout the morning. Commonly depths of 0, 1, 2, 3, 4 and 5 metres were sampled however by the 12.30pm measurement the total depth had reduced to 4.75 metres with the outgoing tide and as a result this was the deepest depth that it was possible to measure.
Figure 3 shows the light attenuation with depth for the pontoon. Light levels are measured as the ratio between the light at depth and the incident light, given in a %. This allows changes in the levels of incident light to be accounted for when measuring the light at depth. Predictably, as depth increases, the light levels decrease. This is an exponential decrease with depth which leads to light levels at the bottom of the channel remaining fairly constant regardless of the amount of light penetrating the surface waters. During the early morning there is very low % of incident light reaching the upper regions of the water column. This is probably due to the fact that, at this time the sun sits low in the sky. Therefore the light hitting the water has a low angle of incidence. This leads to a large increase in the amount of light been reflected off the surface of the water rather than penetrating it. By contrast by late morning the sun is now reaching its zenith and therefore the angle of incidence of the light hitting the water is much closer to 900. This leads to a much higher % of light entering the water. However this light is still attenuated rapidly due to the high sediment load of the estuary. Therefore despite this increase in light the bottom does not see a large increase in light levels.