
Disclaimer: The views expressed in this website are not those of the University of Southampton or the National Oceanography Centre

The King Harry Ferry Pontoon acts as a bridging point for ships and other vessels
crossing the Fal Estuary, and was the location used for the analysis of several variables
during a portion of the estuary’s tidal cycle. Estuaries are greatly impacted by
fluxes due to tidal currents and freshwater influences. This study investigated
the behaviour of several physical and bio-
Four stations were set up to take measurements along the pontoon. Data was obtained every half hour over the course of three hours, from 8:38 to 11:38 UTC, and measured the variables at depth intervals of one meter down to a maximum depth of five meters. The first station utilized a flow meter to measure current velocity of a water column. The next station obtained samples of chlorophyll at the surface. Two samples were taken every half hour by filtering 50 ml of the estuarine water into a bottle using a syringe and filter. Acetone was added to the bottles to preserve their contents. The next station operated a sonde to determine how temperature, salinity, pH, turbidity, and dissolved oxygen varied with depth. Finally, light attenuation throughout the column was obtained using a fluorometer, which calculated the solar irradiance at the surface and at depth.
Pontoon
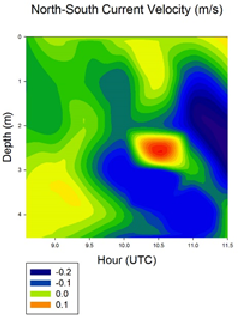
Figure 3. North-
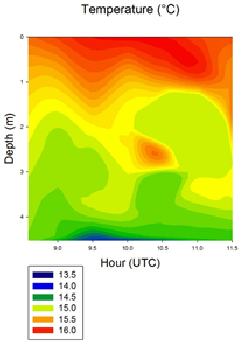
Figure 1. Temperature as a function of depth and time.
Due to the pontoon’s north to south orientation positive values for the v-
The temperature of the water column increased with time by as much as one degree Celsius as solar heating increased, which was more pronounced in the surface waters, as seen in figure 1. Temperature decreased with depth, and the greatest vertical temperature gradient occurred between 10.00 and 11.00 UTC, around the time of high water. Although this can be attributed to the increase in solar heating as the day progressed, an alternative explanation arises from a tidal current perspective. Considering that the high water mark is associated with slack water and a reversal of the tidal current, the absence of tidal currents and therefore turbulence due to bottom friction allowed for greater stratification in the water column (2).
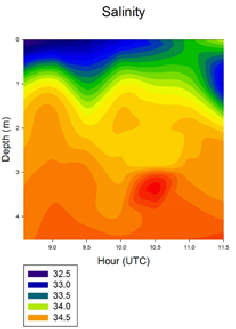
Figure 2 shows that salinity increased with depth, as anticipated. Like temperature, the greatest changes in salinity occurred at the surface. Freshwater runoff, evaporation/precipitation, and tidal currents are the main factors influencing freshwater in an estuary(1). During the period before high water, the northward moving tidal current supplied salty waters to the estuary, which increased salinity at depth, due to saltier water being denser than fresher water. This density difference allows denser water to flow underneath fresher water. The vertical salinity profile is greatest at this time. As it was a fairly sunny day without precipitation, and surface currents were light, the increase in salinity at the surface can be attributed to evaporation.
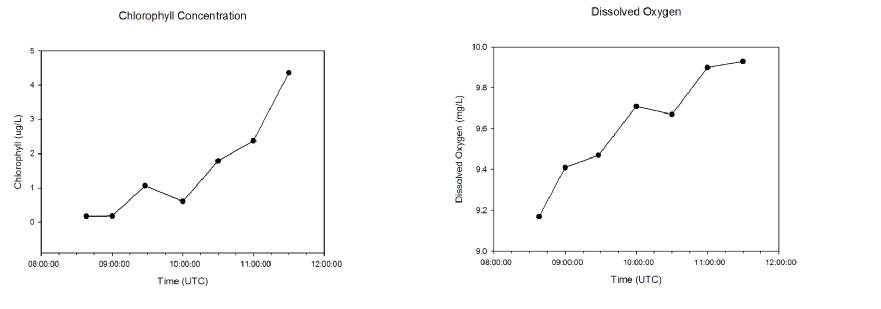
Figure 4. Surface chlorophyll concentrations in time at King Harry Ferry Pontoon.
The chlorophyll data exemplifies the increase of chlorophyll concentration throughout time. As light increases, photosynthesis increases, which requires chlorophyll pigment to capture solar radiation and consequently acts as a source for dissolved oxygen. In both graphs for surface chlorophyll and surface dissolved oxygen, photosynthesis must thus be increasing as time progresses for both variables increase in concentration. According to Yentsch and Ryther, the highest concentrations of chlorophyll are typically observed in the morning and afternoon, compared to that of midday and at night, due to the optimal amount of light and nutrients (4). Therefore, as the amount of light increases, the surface chlorophyll concentration increases in the morning until inhibited by supply of nutrients or light. This increase thus requires an increase of nutrients as well for the primary producers.
The significant vertical gradients of the parameters observed indicate that the Fal Estuary is partially mixed. Although the estuary is mostly tidally driven, the water is deep enough to confine most of the turbulent mixing to the lower depth of the estuary, allowing for stratification in parameters such as temperature and salinity(3). This stratification is enough to support plankton growth throughout the day during this time of year.
Numerous limitations arose when analyzing the data obtained. For a complete picture of the behaviour over the course of a tidal cycle, data would have to be collected over a period of time longer than the three hours this study was confined too. Also, because the pontoon is available for public use, boats and numerous other vessels passed through the work area, which could have possibly influenced parameters such as surface current velocity. The weather, mainly the spotty cloud cover, could also have impacted the results. Wind speed and direction was not obtained with the rest of the data, but could have also affected the results, even though winds were fairly calm throughout the experiment. Finally, the accuracy of the data was limited to the effectiveness of the instruments used throughout the data collection period.
- https://books.google.co.uk/books/about/Marine_Biology.html?id=WugRRR5R2UUC&hl=en
Sumich, James L. and Morrissey, John F, 2004: Introduction to the Biology of Marine Life. Jones and Barlett Publishers International.
- https://books.google.co.uk/books?hl=en&lr=&id=8Q0BBQAAQBAJ&oi=fnd&pg=PP1
Fischer, Hugo B., List, John E., Koh, Robert C.Y., Imberger, Jorg, Brooks, Norman H, 1979: Mixing in Inland and Coastal Waters. Academic Press Inc. - http://journals.ametsoc.org/doi/pdf/10.1175/1520-
0485%282000%29030%3C2035%3ATDOAPM%3E2.0.CO%3B2
W. Rockwell Geyer, John H. Trowbridge, and Melissa M. Bowen, 2000: The Dynamics of a Partially Mixed Estuary*. J. Phys. Oceanogr., 30, 2035–2048. - Yentsch, C. S. and Ryther, J. H. 1957. Short-
Term Variations in Phytoplankton Chlorophyll and their Significance. Limnology and Oceanography. 2003. Volume 2. Issue 2
Figure 5. Surface dissolved oxygen concentration in time at King Harry Ferry Pontoon.
Figure 2. Salinity as a function of depth and time.
Date: 24/06/2015
Latitude: 50°12.976’ N (Taken from group 1, 2014)
Longitude: 05°01.661’ W
Time of First Measurement: 08:38 UTC
Time of Last Measurement: 11:38 UTC
Times of High Water: 11:08 UTC (4.20 m) and 23:26 UTC (4.30 m)
Times of Low Water: 05:19 UTC (1.60 m) and 17:36 UTC (1.70 m)
Weather Conditions: Mostly sunny with intermittent periods of clouds and light wind.

Contents
Information