Introduction
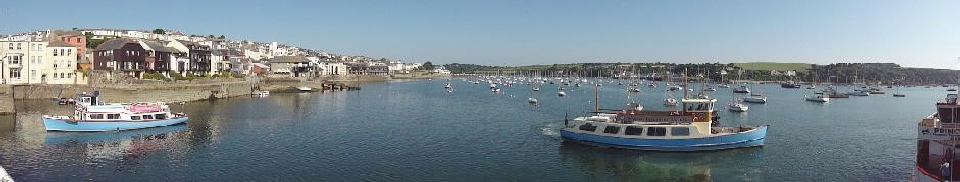
The King Harry Ferris Pontoon, located at 50o12.976’ N and 005o01.661’ W (Figure
52), in the Fal Estuary, was used as a fixed station throughout a tidal cycle in
order to demonstrate the variation in physical-
Methods
The data was recorded every half hour between 08:30 (UTC) and 15:00 (UTC), completing approximately half a tidal cycle
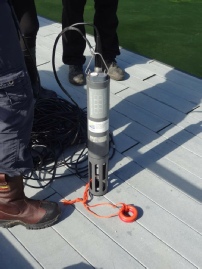
A Valeport Currentmeter (Figure 53) was used to record the speed and direction of the current in 1 meter intervals from subsurface (depth 0m) to the bottom of the water column, according to the tide variation.
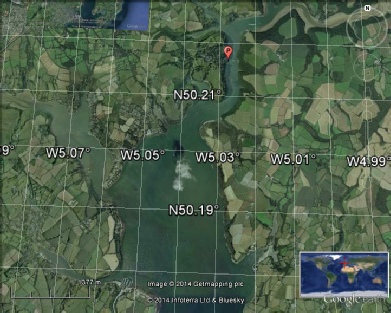
Figure 52: Map of the Fal Estuary with the pontoon location (A).
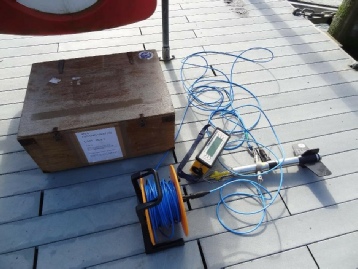
Simultaneously, duplicate water samples were taken from the surface water layer and filtered through an MF filter in order to provide Chlorophyll values and a multiprobe (YSI Multisensor probe; Figure 54) was used, in intervals of about 1m in the water column, to measure:
- Temperature (oC);
- Salinity;
- Chlorophyll (µg/L);
- Dissolved oxygen saturation (%);
- Dissolved oxygen (µg/L);
- Turbidity (NTU);
- pH.
The obtained data was processed in Surfer 8.0® to construct contour maps of the properties time series and its variations.
Figure 53: Valeport Currentmeter
Figure 54: YSI Multisensor probe
Results and discussion
All graphs presented below are time series of the variables collected in the Pontoon station from 8:30 up until 15:00 (UTC). At 8:30 (UTC) the estuary was at ebb tide until approximately 12:00 (UTC) when the patterns changed to rising tide. Weather changed throughout the day, from rainy and with a high cloud coverage in the morning to increasingly sunny and with stronger winds downriver in the early afternoon.
All variables observed present a constant pattern during the first hours of the ebb tide. After 10:00 (UTC), parameters begin to change. Dissolved oxygen saturation (DO%) (Figure 60), pH (Figure 61) and turbidity (Figure 57) rose while salinity values (Figure 56), which were higher in the morning, began to decrease. This pattern changed again close to 14:00 (UTC), when bottom salinity values became high again.
Surface temperature (Figure 55) increases during the day due to the heating of the Sun and decreasing cloud coverage throughout the day, as empirically observed by the researchers at the site. In the period of rising tide approximately at 14:00 (UTC), a small thermal stratification can be noticed in the water column and progresses throughout the remaining sampling period. However it is relevant to notice that the difference between top and bottom temperatures is of approximately 1oC, which is a relatively small variation.
Regarding salinity (Figure 56), it is possible to clearly observe the effects of the tidal currents in the water characteristics. Salinity decreased along the day and reached its lowest value after the lowest tide. Soon after that, rising tide can be observed, when a water body with relatively higher salinity is evident at the bottom of the water column.
Turbidity (Figure 57) can indicate the presence and intensity of tidal currents. It is higher at the bottom layers of the water column due to sediment resuspension, which is caused by increasing currents speed. When the water column is deeper, due to high tide, turbidity values are lower in the water column and the opposite is observed at low tide and, therefore, higher turbidity is noticed.
Along the day it was possible to notice an inversion on the predominant currents directions, according to the variation of the tidal cycle, as seen in Figure 58.
Analysing the pH and temperature graphs (Figure 60 and Figure 55), it is possible to infer that primary production was higher in the early afternoon period, since pH values (Figure 60) were higher, indicating that possibly phytoplankton was consuming CO2 and producing O2. Through visual observation, wind velocity was thought to have increased at this time which can increase surface mixing and, therefore, elevate oxygen concentration (Figure 59).
Dissolved oxygen saturation (Figure 59) was always supersaturated in the estuary. Lowest values were identified in the morning and in the deepest measurements of the afternoon stations, but increased at surface during the afternoon, which may be caused by increase in wind speed at surface level or rise in primary productivity.
In Figure 61, it is possible to observe that the chlorophyll profiles present a decrease in concentration throughout the day. This may be a result of Chlorophyll degradation due to sun light exposure.
Conclusion
The results from the Pontoon fixed station support the fact that the Fal estuary is well mixed. Physical and chemical properties do not present considerable vertical variations throughout the sampling period. The minor variations observed for temperature and salinity can be related to the tidal cycle and weather variations.
Limitations
Although data obtained could be used to sustain estuary findings, there are clear limitations to the method. Different researchers operated the equipment, which increased the possibility of measurements errors, as these were not standardized.
Meteorological parameters, as wind and rain, might have influenced the values, mostly on surface, however these variables were not appropriately measured, but only subjectively observed, and using them to explain variations represents another uncertainty.
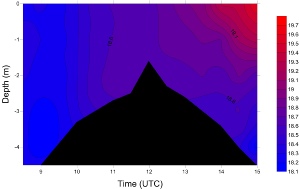
Figure 55: Temperature time series
Figure 56: Salinity time series
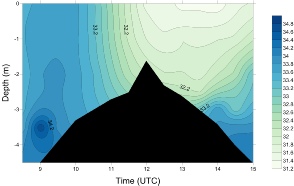
Figure 58: Currentmeter time series
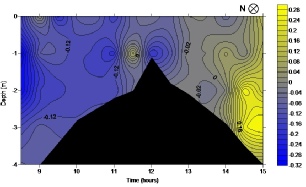
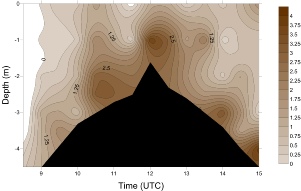
Figure 57: Salinity time series
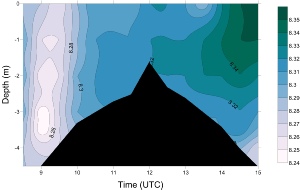
Figure 60: pH time series
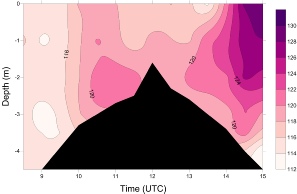
Figure 59: DO% time series
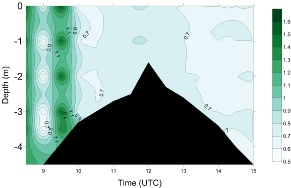
Figure 61: Chlorophyll time series