 View More
View More
Disclaimer
The views and opinions expressed are of those of the members of Group 8 and are not
representative of University of Southampton or National Oceanography Centre.
View More

INTRODUCTION
The Tamar-Tavy estuary incorporates the tidal estuaries of the River Tamar, Tavy
and Lynher which collectively drain an extensive part of Devon and Cornwall (Prichard,
1967 and JNCC, 2010). Prichard (1952) defined estuaries as ‘a semi-enclosed coastal
body of water with a free connection to the open sea and within which seawater is
measurably diluted by freshwater.’ (Callaway and Specht, 1982). Being a meso-tidal,
partially mixed estuary a distinct thermocline would be expected between less dense
surface waters and denser deeper waters in which tidal energy is likely to be sufficient
to create shear along the halocline. The River Tamar and its tributaries provide
the dominant freshwater input to the Plymouth Sound and estuaries system with an
average annual flow of 30m3s-1.
AIM
To sample from Calstock down to Breakwater in order to investigate the chemical,
biological and physical mechanisms occurring within the estuary and the degree of
mixing from freshwater and seawater interactions.
 RIBS
Falcon Spirit
RIBS
Falcon Spirit
RESULTS
In an attempt to achieve this, the estuary was sampled using three vessels, Porky
Pig (sampling upper Tamar), Flying Pig (sampling mid Tamar) and Falcon Spirit (sampling
lower Tamar) and the data obtained was used in conjunction to achieve results representative
of the estuarine system as a whole.
TEMPERATURE/SALINITY
The temperature and salinity graph displays how both temperature and salinity vary
with respect to distance down the estuary, beginning at the sample site furthest
up the estuary (50°30.182'N, W004°10.826') and sampling downstream. It can be seen
that from sites 1-12 salinity increased linearly from 0.42 to 22.5 PSU, followed
by a sharp increase and then a gradual shallowing of the line. There’s a subsequent
sharp decrease of 7.22 which is attributed to switch in sampling from group 1 to
group 2 and it can be seen from the recorded coordinates of sample sites that samples
from the two groups overlapped slightly (by 0°3.146 latitude and 0°1.288 longitude).
From this site salinity increased, albeit at an inconsistent rate, from 23.18 to
34.6 PSU.
The variation in temperature between sites is much less prevalent, thus, demonstrating
that the estuary is well mixed. Evidence for this is also portrayed via the temperature
and salinity profiles collected via the CTD on Falcon Spirit. Slight variations can
be seen between sites 1-16, however once again a large difference (increase of 3.2°C)
is seen at the point which sampling swapped from group 1 to 2. However, it could
also be due to inter-group differences in both methods and the probes. A sharp decrease
is also seen when sampling swapped from group 2 to the Falcon spirit, which again
could be due to slight inaccuracies in the equipment and differences in method.
NUTRIENTS
Silicate (Fig. 6&7)
The estuarine mixing diagram for dissolved silicate concentrations suggests non-conservative
behaviour as a result of removal with the majority of individual sample points lying
below the TDL. This correlates with high chlorophyll concentrations at corresponding
stations with a high number of diatoms. This would be expected for July (05/07/2019),
due to the dynamics of temperate phytoplankton blooms suggesting removal of dissolved
silicate by diatoms - utilised for their opal tests (Western Channel Observatory,
2011).
NO3+NO2 (Fig. 8)
The relationship between salinity and total nitrogen concentrations for the Tamar
evince conservative behaviour of total nitrogen concentrations in the Tamar Estuary
due to the close association of the individual data points to the theoretical dilution
lines. There are some discrepancies in which three data points stray noticeably from
the TDL [(0.42, 2.50), (23.18, 13.28), (27.5, 56.46)]. Further analysis is required
to decipher the nature behind these points and whether they are potential anomalies.
Consequently, variation in the distribution of total nitrogen concentrations on the
05/07/2019 is likely to predominantly be due to the mixing and the physical dilution
of river water by sea water (Western Channel Observatory, 2011).
NO3 (Fig. 9)
Similarly nitrate concentrations demonstrate conservative behaviour despite one noticeable
deviation from the TDL (32.08, 45.433). This is likely to be due to the fact that
the majority of nitrogen in the estuary is in the form of NO3 as opposed to NO2.
There is slight evidence of removal however, further analysis/ research is needed
to understand the potential reasons behind this.
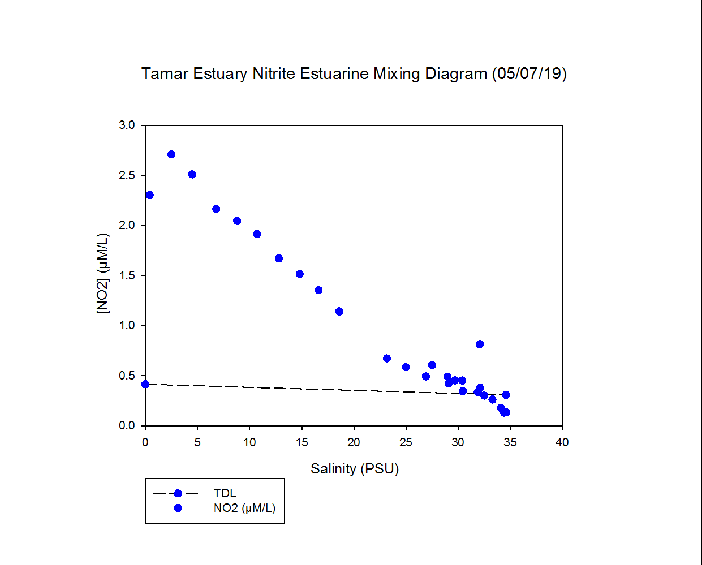
Nitrite (NO2) and Phosphate (PO4) (Fig . 10 & 11)
IIn contrast nitrite concentrations portray an evident positive deviation from the
TDL providing evidence of non-conservative behaviour by addition However, this should
be investigated further to decipher the exact cause.
Due to technical difficulties with the spectrophotometer in the lab, phosphate samples
were not taken in the field, consequently, the estuarine mixing diagram is constructed
on the results of the auto-analyser. Thus, its representativeness can be queried.
Phosphate also demonstrates non-conservative addition, like Nitrate, which could
potentially be a consequence of additional point sources, perhaps due to sewage discharge
along the river in the densely populated region, especially from station B to C (Langston
et al., 2003).
PHYTOPLANKTON ABUNDANCE
The majority of species found in samples were diatoms, this is to be expected due
to their observed seasonal succession in these waters (Widdicombe et al., 2010).
It can be seen that different species of phytoplankton dominate at different points
along the Tamar estuary, for example at a salinity of 26.9 PSU (Fig. 16) 53% of the
present speacies were Cilliate spp. Whereas at 0.42 PSU (Fig. 20) both Alexandrium
spp. and C. asteromphalus had 38% dominance.
For the phytoplankton samples, the phytoplankton with the highest overall abundance
along the Tamar Estuary appear to be Skeletonema, Pluerosigma spp., Mesoporos perforates
and Chaetoceros spp. High abundances of Pleurosigma spp would be expected in the
upper reaches of the Tamar, due to the fact it is a benthic species that is often
re-suspended via estuarine mixing. The highest numbers of Skeletonema occurs toward
the top of the estuary, with a total of 44 organisms being counted in the samples
below a salinity of 26.9 PSU (Fig, 16). The Chaetoceros spp. is more abundant in
the middle course of the estuary, where between the salinities of 22.5 (Fig. 18)and
26.9 PSU (Fig. 16), the total count was 25.

ZOOPLANKTON
For each sample taken, the highest number of Zooplankton counted was Copepoda, although
this varied from 378.59m-3 at site B0 down to just 37 m-3 at G. This relates to the
large difference in overall Zooplankton numbers seen; the overall total of organisms
seen at sites A1 (Fig.22) , B0 (Fig.23) and C0 (Fig. 24) are 463.43 m-3, 561m-3 and
519.03m-3 respectively, while the respective values at sites G (Fig. 25) and I (Fig.
26) are 52.6m-3 and 256.5m-3. Past the constant higher Copepoda numbers, the numbers
of other zooplankton seen show little trend, other than the Decapoda larvae numbers
counted were second highest at sites B0 (Fig.23) (56m-3), C0 (Fig.24) (103.81m-3)
and I (Fig.26) (33.3m-3). The Zooplankton numbers are a lot higher further up the
estuary that towards the mouth, which can be seen especially at site I.
The above graph displays the inter-site variation in abundance of different zooplankton
species. It is evident that copepod species heavily dominate at all sites. Their
dominance is likely due to their torpedo-shaped body, sensory armed antennules and
the ‘gearing’ of the muscle motor allow them to be very efficient in detecting and
evading predators. It could also be due to their capability to remotely detect prey
and either capture them in a current or as they swim within the copepods perceptive
range. Another potential reason for their dominance is their efficiency in finding
a mate, especially when populations are sparse (Kiorboe, 2010).
CHLOROPHYLL
Figure 27 demonstrates a noticeable peak in chlorophyll concentration to 23μg/L at
approximately 27.1 PSU. This is potentially due to the fact that this is where the
River Tamar and Tavy meet resulting in increased mixing and nutrient re-suspension
resulting in an abundance of phytoplankton represented by this increase in chlorophyll
(Mommaerts, 1969). From observing estuarine mixing diagrams, there is, perhaps, an
associated increase in phosphate concentrations to 0.68μM/L at a salinity of 27.1
PSU. This is potentially a result of point sources located further downstream, consequence
of the dense population and resultant sewage discharges into the Tamar (Langston
et al., 2003). Dissolved silicate concentrations evince removal at a salinity of
27.1 PSU which is therefore, likely to be due to uptake by diatoms for their opal
tests (Mare, 1940).