

Meet the team!
Disclaimer
The views and opinions expressed are of those of the members of Group 8 and are not representative of University of Southampton or National Oceanography Centre.
PLYMOUTH FIELD COURSE 2019
About the survey
Between the 3rd and 9th July 2019, we carried out a series of surveys at the Tamar Estuary, the off shore L4 station and the breakwater zone of the Plymouth Sound; to give biological, chemical and physical data to be used to understand the environmental processes and their effect on the fauna and flora of the region. Plymouth Sound and Estruary systems hosts many nationally rare species due to its uncommon environmental set, hence make any scientific data about the region important to develop strategies to recover and protect the habitats. The surveys carried out include: habitat mapping of the Breakwater zone using sidescan sonar and towed video system; water sampling along the Tamar estruary for analysis of salinity, nutrients and chlorophyll; and both depth profiles and sampling for a selection of sites stretching out south from Plymouth breakwater to past Eddystone Rocks.
Geophysics
One of the surveys, undertaken with intent to provide a biological viewpoint of Plymouth
sound, was to create a habitat map of an area south of the breakwater. This involved
three different techniques which would all be pieced together to create an accurate
representation of the chosen site. The first, and most useful, technique was to perform
a sidescan sonar survey of multiple parallel tracks covering the area and to piece
together these printed traces; then scaling this down onto a track plot. The next
technique was a towed-
Tamar Sampling
Another aspect of this study was periodic sampling of the chemical content and plankton
abundance along the Tamar estuary, starting at approximately zero salinity and finishing
as the salinity reached sea-
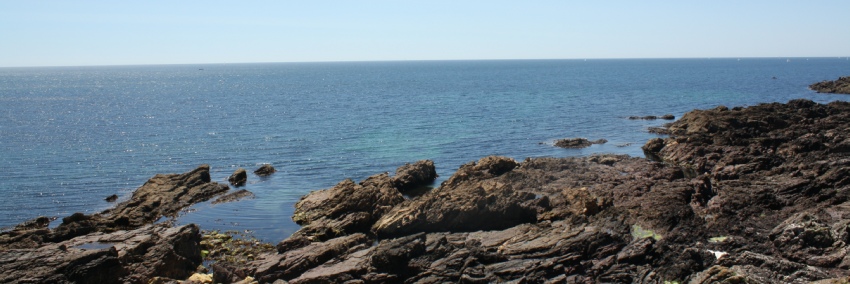
Offshore
The final section of this investigation focused on offshore data; with both CTD depth
profiles and Niskin Bottles being performed at five different sites spaced near-
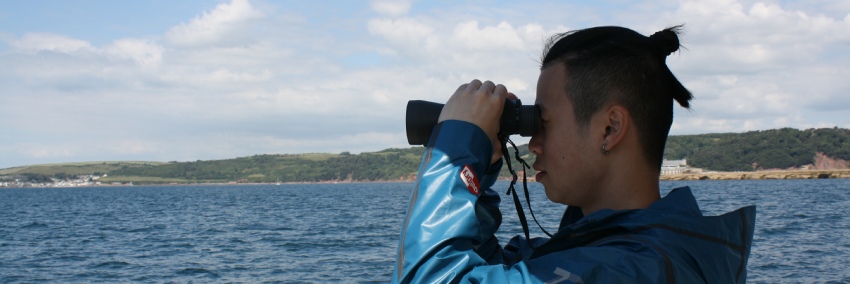
TOW FISH
Scanning the Plymouth sea floor .
Tow fish are invaluable in habitat mapping – allowing for quick results that can easily be visualised, with side scan sonar. Aboard the Echo explorer, we explore this effective way of detecting substrate types and topography, also with the use of a video drift and sediment grab.
FLYING PIG AND PORKY PIG
Sampling on RIBS in Tamar Estuary.
The collection and analysis of nutrients, phytoplankton, zooplankton and chlorophyll samples were done on RIBs called Flying Pig and Porky Pig,to determine the extent of mixing that occurs in the Tamar.
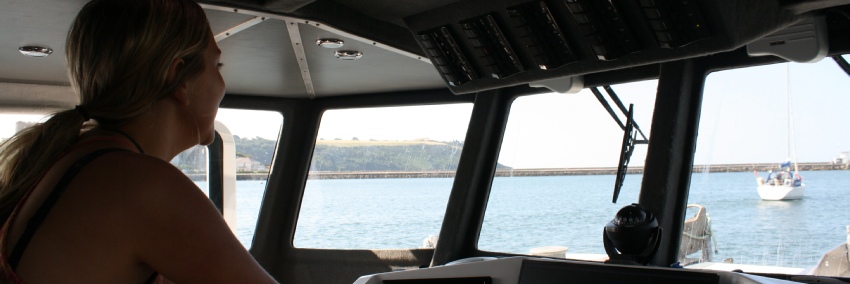
ON THE CALLISTA
Offshore data collection on Callista
Using a CTD, data was collected offshore to determine dissolved oxygen content, chlorophyll concentration, Photosynthetically Active Radiation, alongside other parameters. Vertical nets were also used to sample phytoplankton.
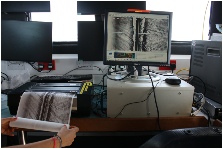
SNAPSHOT
A side scan sonar track plot in process (Echo Explorer). The plot is printed, and displayed on the monitor, as the computer receives the data from the tow fish, which is constantly being towed.
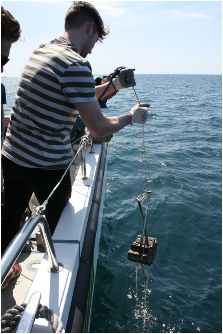
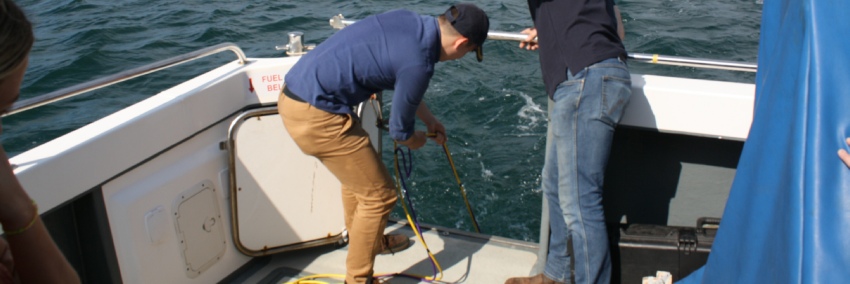
A sediment sample, collected using a Van Veen grab, being taken aboard the ship (Echo Explorer) for processing and analysis.
| Flying Pig & Porky Pig |
| Falcon Spirit |
| Biological |
| Chemical |
| Physical |