
|
Date |
03/07/2017 |
|
Time on Station (UTC) |
13:25 - |
|
Location |
50˚ 5.67N, 4˚ 52.02W |
|
Weather |
Overcast (8/8) Sea state: 1 High Cloud Base |
|
Wind (mph) |
10 (South West) |
|
Water depth (m) |
67 (0.5m swell) |
|
Pasty |
Oggy Oggy (4/5) Recommended: Traditional – Can’t go wrong with Traditional in most places |
Introduction
The aim of this survey was to assess the vertical abundance and distribution of different phytoplankton and zooplankton species over a temporal scale at the offshore site in Falmouth, UK.
Methods
Collecting phytoplankton
Three phytoplankton samples were collected using a bucket at one site (50° 16’N; 005° 06’W) on the 04/07/17 and labelled bottles 40, 46 and 37. The first sample collected (Bottle 46) was at 1330 (UTC) followed by the second bottle (37) at 1433 (UTC) and finally the third sample (bottle 40) was collected at 1555 (UTC). Lugol’s bottles that contained iodine were filled with sample water from their corresponding buckets. The iodine was used to fix the cells and stain them to allow for a more concentrated, visible sample when studied under a light microscope. Once onshore the samples were transferred to the lab where they were left to settle overnight. A vacuum was then used to remove the top 90% of solution, leaving the bottom more concentrated 10% to be transferred to labelled plastic sample bottles. 1 ml of each of the samples were pipetted into Sedgewick rafter cells and analysed under a light microscope. Individual phytoplankton cells were counted across 100 Sedgewick rafter cells. Identification books were used to formally classify the phytoplankton cells. Data management and graphs were created using Excel Spreadsheet 2016.

Collecting zooplankton
Paired ‘bongo’ plankton nets (of differing mesh size 100μm and 200μm), were deployed twice at the offshore site for 10 minutes each, whilst the vessel was in motion. The first deployment was at 17.32m, approximately the location of the deep chlorophyll maximum according to CTD measurements. The second deployment was at 3m to allow us to analyse and compare species present at different depths. The towing distance along with the diameter of the nets, allowed for an approximation of the volume of sea water sampled to be calculated. This was only an approximation as, due to the ADCP being unavailable, no flow reading was taken and so could not be taken into account.
To minimise contamination, the nets were washed between deployments. For each 1l bottle of sample, 10ml of 10% formaldehyde solution was added as a preservative.
Back onshore, subsamples of 5ml and 10ml were placed under light microscopes in Bogorov and the zooplankton seen were identified and counted. This data was then used to calculate the number of zooplankton per m³ of seawater.
Chemical analysis
Aim: The aim was to measure how Nitrate, Silicate, Phosphate, Oxygen and Chlorophyll
levels change temporally at one offshore station (50o 5.67N, 4o52.02W) in Falmouth,
Cornwall, UK.
Water samples were collected from the surface using a bucket to measure
nitrate, phosphate, silicate and dissolved oxygen levels temporally at the same location.
The concentrations were calculated using standard methodology:
Phosphate and Silicate:
Parsons et al.,1984.
Oxygen: Grasshof et al., 1999.
Nitrate (by flow injection analysis):
Johnson et al.,1984.
Zooplankton
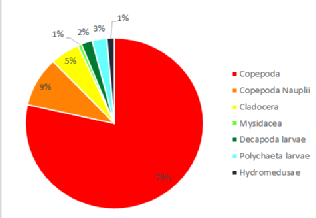
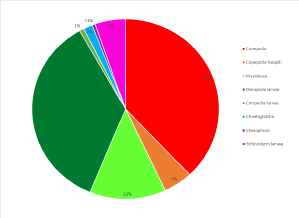
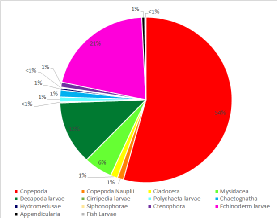
The zooplankton collected at the site were heavily dominated by copepod sp. forming
an average of 59% of the population over both trawls at both mesh sizes, including
the larval form copepoda nauplii. (Figure 1 -
Echinoderm larvae s p., decapod larvae
sp. , Mysidacea sp. polychaete larvae sp. were also found in ample quantities and
together contributed a notable 35.5% of the zooplankton species found at the offshore
site. A variety of other species were also found in low abundance and executing the
trawls at varying depths of 17.3m and 3m, respectively, allowed us to see some of
the vertical species variation in the water column. The high overall abundance of
copepod sp. was expected as they are considered the most prevalent metazoans on earth
and are crucial contributors to the pelagic food web and microbial loop. (Nielsen
and Richardson, 1989)
Phytoplankton
Temperature and irradiance are no longer limiting factors in phytoplankton growth
as the samples were obtained during the middle of the summer (See Physics). The presence
of nutrients  at the surface also allow for phytoplankton abundance to grow (See Chemistry).
In all three samples Nitzschia was the most dominant phytoplankton collected at station
1. The abundance of diatoms is determined by the availability of silicon which diatoms
use to form frustules of silicon in a protective shell like formation (Treguer et
al. 1995). The presence of silicon (Figure 7) at station 1 allows for the dominance
of diatom species such as Nitzschia, the minimum amount of silicon available for
an increasing growth rate for Nitzschia species is 0.05 mmol/litre (Lewin; 1955),
all three samples of silicon were calculated between 0.07 mmol/litre and 0.28 mmol/litre.
The reason diatoms are regarded as the most dominant species of phytoplankton in
the Northern Hemisphere during the spring and summer bloom (Yool & Tyrell; 2003)
can be explained by their silica shells which require less energy to form in comparison
to other shell forming phytoplankton (Raven; 1983). Diatoms (in this case Nitzsch
 ia)
are therefore protected at an earlier stage and are able to expend more energy on
growth (Furnas et al. 1990). According to Morin et al. (2008) Nitzschia sp. have
a growth rate of 0.41 div day-
Leptocylindricus and Chaetoceros were also highly abundant across all three samples
which is in keeping with previous studies that show that these species are abundant
in late spring and summer in Northern European seas (Kraberg et al. 2010). The first
sample (Bottle 40) was the most diverse in terms of species with 11 different species
counted, compared to 9 in the second sample (bottle 37) and 6 in the third sample
(bottle 46) (Figure 6). In the first sample there were 5 species present that were
not present in the following samples. This could be because the first sample was
taken in a relatively undisturbed environment – disturbance increased at the surface
at station 1 during the course of the boat activity.
Due to the fact that only a metal bucket was available on board, only surface measurements were taken. We were therefore unable to take measurements at depth and could not collect samples for comparison of the deep chlorophyll maximum and thermocline with respects to phytoplankton vertical migration. The Teramar experienced technical difficulties at the start of the day which delayed our expedition.
Temperature
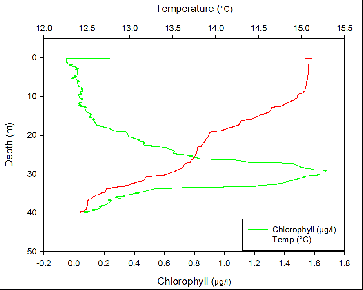
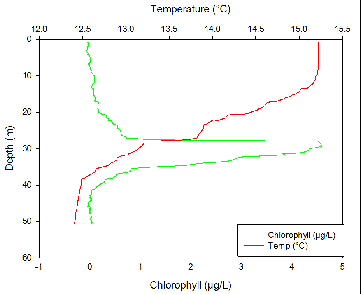
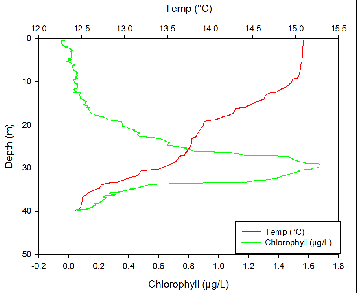
Temperature at all four stations decreased slowly from the surface down to around 10m with a temperature change of only around 0.1ºC. after around 10 meters there is a small, diurnal thermocline. Temperature then decreases again until the seasonal thermocline at around 25m at all stations other than station 3. At station 3, there is a much steeper seasonal thermocline at around 28m where temperature decreases by about 0.8ºC within a meter of water.
Fluorometry
The thermocline corresponds to the nutricline due to a stable water column which reduces mixing at the interface above and below the thermocline, which traps nutrients. Phytoplankton require nutrients to grow and reproduce. Therefore, it would be expected for the largest phytoplankton numbers to be just below the thermocline where nutrients are highest but there is still light for photosynthesis. This is shown to be true at all three stations.
The CTD we used did not measure density or transmission. We also did not have an ADCP so could not calculate the Richardson number to look at water column stability.
Due to a variety of technical issues, only a small time window was available so only three samples were taken (and all at the surface), making it difficult to draw any concrete conclusions about the fluctuations in nutrient concentrations over time. Additionally, as a result of an error in the lab, the values for phosphate concentration were not accurate. The values presented were correct relative to each other so could be used for comparison but were not absolute.
again within the next thirty minutes. With the exception of silicate, the final value was greater than the initial measurement. The total range of phosphate, silicate and nitrate concentrations were 0.12 µmol/litre, 0.08 µmol/litre and 9.35 µmol/litre respectively (although, this may not have been precise for phosphate). All three of the nutrients fluctuated reasonably similarly, with their concentrations being inversely proportional to the abundance of phytoplankton. This was because the nutrients were taken up by the phytoplankton for metabolic purposes. Therefore, the more phytoplankton present, the lower the concentration of nutrients and vice versa.
As the dataset was only collected over 1 hour 40 minutes and the nutrient concentration rose and fell very quickly, it was unlikely that there was such a sudden increase in phytoplankton at the surface followed by such a rapid drop. A more likely scenario would be that, whilst the aim was to sample the same station multiple times to create a time series, the vessel drifted slightly into an area with more phytoplankton at the surface. However, as there were so few samples collected, it was difficult to say for certain what happened or to suggest any temporal trends.
Offshore

Disclaimer: All the opinions expressed in this site are that of Group 2 and not necessarily the University of Southampton or the National Oceanography Centre.
b)
c)
Click charts to enlarge
Click charts to enlarge
The values for the number of phytoplankton were calculated by counting the total number of phytoplankton cells (all species) seen in 100 squares of a Sedgewick Rafter cell for each sample and averaging any replicates.
The concentrations of all the nutrients reduced in the hour between the first and second sample and rose
Click charts to enlarge
Click charts to enlarge
Map with the location that the time series was collected from (50° 5.67N 4°52.02W) on 03/07/17.
a)
| About Us |
| Overview of Falmouth |
| Biology |
| Physics |
| Chemistry |
| Physics & Chemistry |
| Biology |
| Physics & Chemistry |
| Equipment |
| Vessels |
| References |
