
Information
Sampling was carried out at the King Harry Pontoon (50°12’58” N 5°01’40.8” W) on 21st June 2016 between 12:00 and 15:00 GMT. The objective was to develop a times series data set for a number of biological and physical variables. This allowed a study of how conditions on the River Fal varied over the course of a tidal cycle.
DISCLAIMER: The words and views expressed here solely represent the findings made by this group and by no means those of the University of Southampton.
Sampling was carried out at half hour intervals from 12:00 to 15:00 GMT to generate seven data entries.
A Niskin water bottle was used to collect waters samples at the surface, 1 meter and 2 meter depths in order to develop a depth profile of chlorophyll concentrations for each data entry. Two replicates were taken for each depth, however, there were not enough bottles to enable collection at 15:00 GMT. A syringe was used to measure 50ml of each water sample, which were then passed through a filter and preserved in 5% acetone solution. These were store in a freezer over night to break up the filter and prevent microbial alteration. On the morning of the 22nd June 2016, the chlorophyll concentration of each solution were analysed using a 10-AU fluorometer.
An exo-probe was used to measure temperature, salinity, dissolved oxygen concentration and pH with depth. The turbidity sensor on the exo-probe was not functioning at the time of sampling.
A flow meter was lowered into the water column to measure the speed and direction of the flow at depths of 1, 2 and 3 meters.
Light intensity was measured using a surface probe and a depth probe in tandem. The depth probe measured the light attenuation through the water column whilst the surface probe acted as a standard which is used relative to the depth probe, removing any changes that may be made in light intensity due to variations in cloud coverage and other light inhibiting actions. This was done just below the surface and at depths of 1, 2 and 3 meters.
Contents
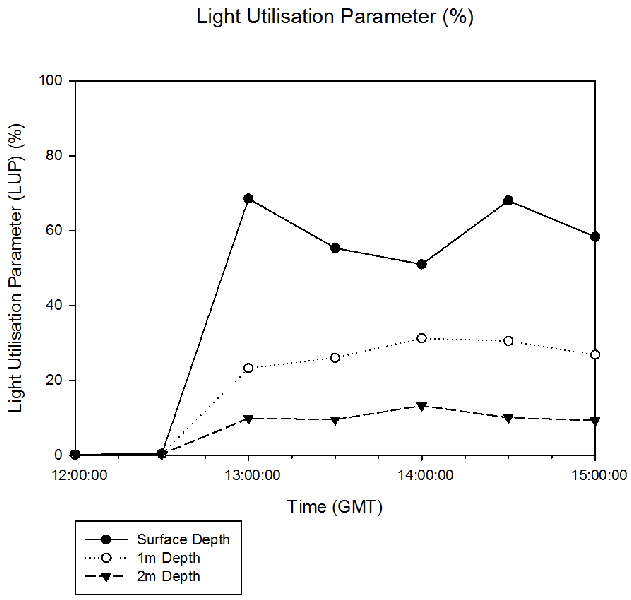
Light utilisation parameter (LUP) decreased with depth (Figure 43). This is because photons attenuate exponentially with depth as they are absorbed by water molecules and scattered by particles (Pegau et al., 1997). The fluctuations in LUP at the surface may be a consequence of changes in weather conditions. There was a period of light rain and increased cloud cover at approximately 13:30 GMT, which would explain the decrease in LUP. The 12:00 GMT and 12:30 GMT results are close to 0% for all three sampling depths and are, potentially, anomalous. This was likely the result of issues with the in-water irradiance sensor. Light intensity decreased over the duration of the time series (12:00-15:00 GMT). Consequently, the highest LUP value was calculated at 13:00 GMT and the lowest was at 15:00 GMT.
Dissolved oxygen decreased with depth (Figure 39). This can be linked to changes in chlorophyll concentrations, which increased over the course of the time series due to a number of factors, such as light intensity and nutrients. (Figure 38 & Yentsch & Ryther, 1957). At 2 m water depth, there is less light available for photosynthesis. As a result, the phytoplankton stocks are small relative to the surface (McMahon et al., 1992). A possible anomaly occurred at 14:30 GMT. Chlorophyll concentration at 2 m water depth increased unexpectedly. This caused an increase in dissolved oxygen concentration at the same depth. However, LUP did not increase in tandem, which likely suggests a mixing event, probably due to the arrival of the Enterprise tourist boat at 14:13 GMT.
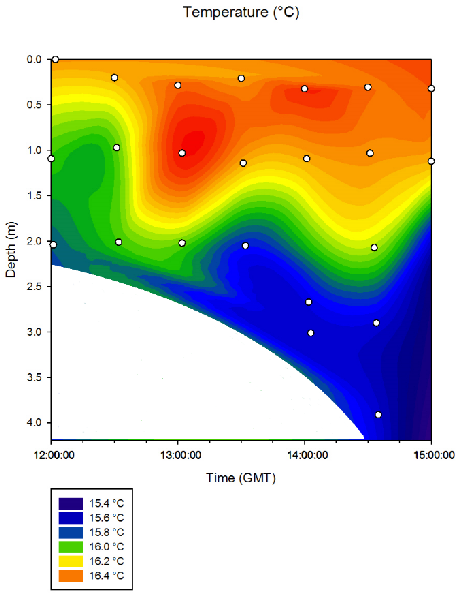
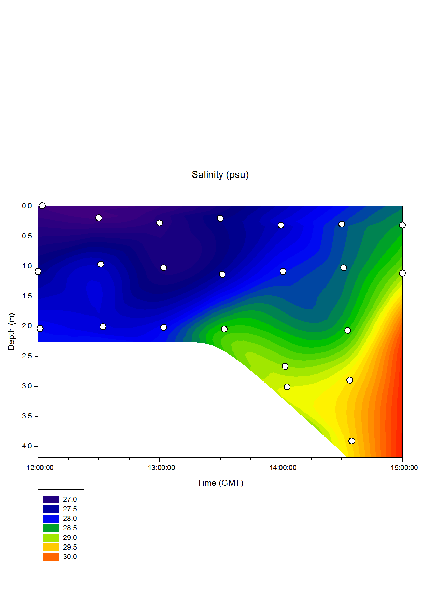
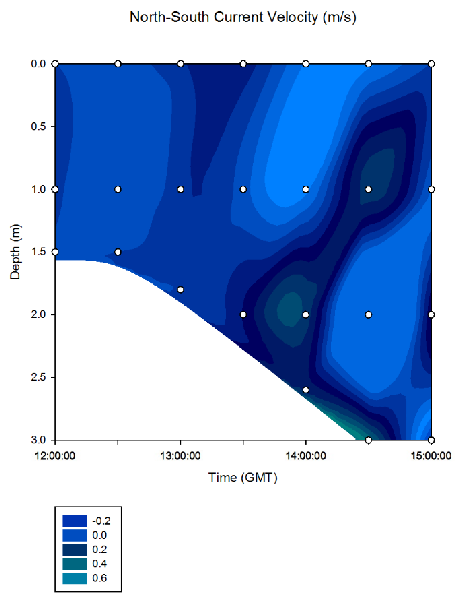
The results for North-South current velocity and salinity are displayed in Figures 40 and 41 respectively. Salinity was in the expected range of estuarine water. Low tide occurred at 12:07 GMT, meaning the water column was relatively still at this time. Over the course of the time series, more saline water was imported by the incoming tide. This is supported by Figure 40, which shows there was little to no current at approximately 12:00 GMT and it increased over the course of the time series. The incoming saline water is more dense relative to the fresher water supplied by the Rivers Truro and Fal. As a result, there was haline stratification into a surface freshwater mass and an underlying saline body of water. This is further supported by Figure 42, which displays the fluctuations in water temperature over the time series. The whole water column is relatively warm (16.0-16.4 °C) at approximately 12:00 GMT. The gradual influx of saline seawater on the incoming tide caused a sharper temperature gradient with depth (15.4-16.4 °C).
McMahon, T.G., Raine, R.C.T., Fast, T., Kies, L. & Patching, J.W. (1992) Phytoplankton biomass, light attenuation and mixing in the Shannon estuary, Ireland. Journal of the Marine Biological Association of the United Kingdom, 72.3, 709-720.
Pegau, W.S., Gray, D. & Zaneveld, J.R.V. (1997). Absorption and attenuation of visible and near-infrared light in water: dependence on temperature and salinity. Applied optics, 36.24, 6035-6046.
Yentsch, C.S. & Ryther, J.H. (1957). Short-term variations in phytoplankton chlorophyll and their significance. Limnology and oceanography, 2.2, 140-142.
Date: 21st June 2016
Time (GMT): 12:00 to 15:00
Lat: 50°12’58” N
Long: 05°01’40.8” W
Low Tides (GMT): 12:07
High Tides (GMT): 05:41, 17:56
Tidal Range: 4.2m
Weather Conditions: light rain and 8/8’s cloud coverage at start, 3/8’s cloud coverage and sun at end.
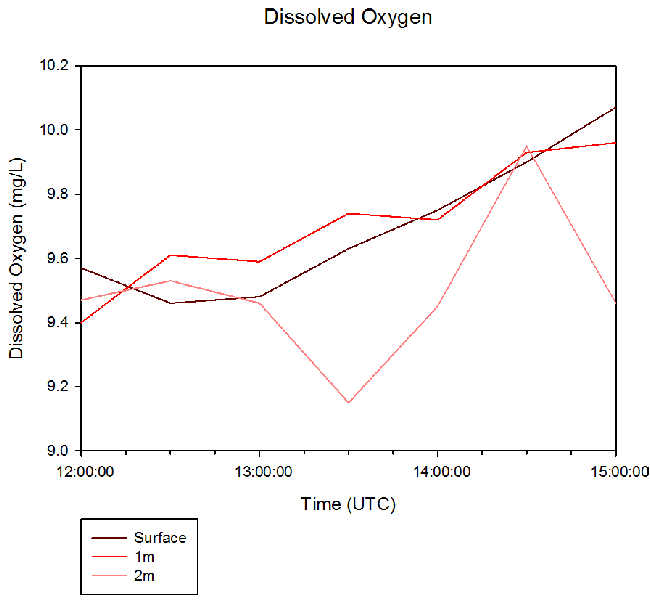
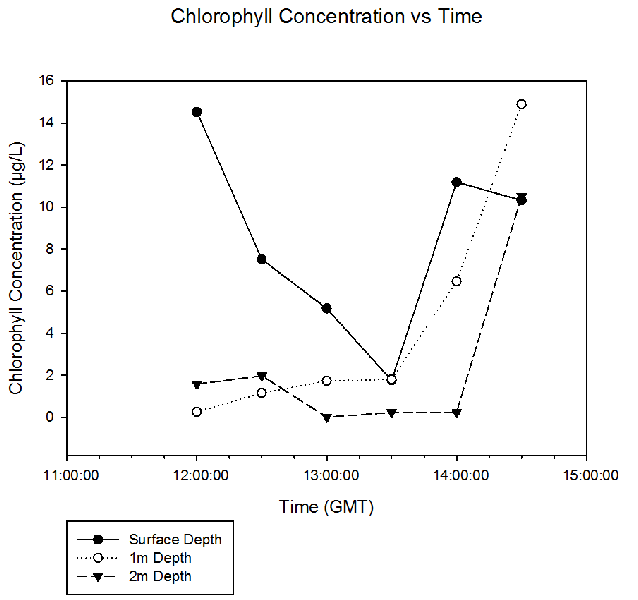
Figure 40. The north-south current velocities (m/s) with depth over a 3 hour time series in half hour intervals.
Figure 39. Graph of dissolved oxygen concentrations in mg/L over a 3 hour time series in half hour intervals.
Figure 41. The change in salinity (psu) with respect to depth over a 3 hour time series in half hour intervals
Figure 42. The pattern of water temperature (°C) with respect to depth over a 3 hour time series in half hour intervals.
Figure 38. The change in chlorophyll concentration (µg/L) sampled at three different depths (surface, 1 m, 2 m) against time in half hour intervals.
Salinity
Figure 41 shows the salinity structure of the water column over the course of the time series (12:00 - 15:00 GMT). Low tide was at 12:07 GMT. At the start of the sampling period, the seabed was located at 2.5 m water depth, and by 14:30 GMT the water column was approximately 4 m deep. Between 12:00 and 13:00 GMT, the water column was dominated by relatively fresh water. There was some stratification into a surface fresh water layer and a deeper more saline body of water. By the end of the time series, the water was more saline reaching a maximum of 30.0 psu. Stratification was still evident, however, the surface fresh water layer was thinner.
Chlorophyll concentration
Figure 38 describes the change in chlorophyll concentration with time at King Harry Pontoon. At the surface, chlorophyll concentration declined between 1200 GMT and 1330 GMT from 14.52 μg/L to 1.75 μg/L respectively. Chlorophyll concentration then increased to 11.18 μg/L at 1400 GMT where it stabilised for the remainder of the time series. Chlorophyll concentration at 1 m water depth increased over the course of the time series from a low of 0.26 μg/L at 1200 GMT to 14.88 μg/L at 1430 GMT. At 2 m water depth, chlorophyll concentration remained relatively constant, except for a large peak of 10.51 μg/L at 1430 GMT. In contrast to other measurements, chlorophyll was not sampled at 1500 GMT due to a lack of sample bottles.
Dissolved oxygen concentration
The change in dissolved oxygen concentration with time is displayed in Figure 39. Dissolved oxygen, generally, decreased with depth. A relatively steady increase in dissolved oxygen at the surface was observed over the course of the time series (from 1200 – 1500 GMT). Dissolved oxygen was lowest at 1230 GMT (9.46 mg/L) and highest at 1500 GMT (10.07 mg/L). Similarly, concentration of dissolved oxygen at 1 m water depth increased, with some variability, from 9.40 mg/L at 1200 GMT to 9.96 mg/L at 1500 GMT. At 2 m water depth, dissolved oxygen concentration declined from 9.47 mg/L at 1200 GMT to 9.15 mg/L at 1330 GMT before increasing to a high of 9.95 mg/L at 1430 GMT.
North-South Current Velocity (m/s)
The North-South current velocity structure of the water column can be seen in figure 40. There is little to no current in the water column at 12:00 GMT. It is important to note that the seabed was 2.5 m at 12:00 GMT. By 14:30 GMT, the seabed was located at approximately 4m water depth, which featured a stronger current at depth at this time. There was very little current throughout the time series (12:00 - 15:00 GMT). At 14:00 GMT, the current in the upper 1 meter of the water column was moving in the opposite direction to the predominant flow.
Temperature
Figure 42 describes the temperature structure of the water column. Broadly, two distinct water masses can be distinguished a warm surface layer and a deeper cooler water mass. Water temperature reaches a minimum of approximately 15.4°C at 3.5 m at 15:00 GMT. Water temperature remains relatively consistent in the upper 0.5 m of the water column throughout the time series with the exception of a parcel of exceptionally warm water at a depth of 1 m depth at 13:00 GMT.
Figure 43. The trend of LUP with respect to depth over a 3 hour time series in half hour intervals.
LUP vs Time
The change in the Light Utilisation Parameter (LUP) with depth over the course of the time series is displayed in figure 43. LUP, generally, decreases with depth. It is relatively constant at 1 m and 2 m depths over the course of the time series, however, is more variable at the surface. The highest value was recorded at 13:00 GMT at the surface (68.54%) and the lowest was measured at 15:00 GMT at 2 m water depth (9.23%). Potential anomalies can be identified at 12:00 and 12:30 GMT where LUP is close to 0% at the surface, 1 m and 2m depths.
(Click Picture To Enlarge)
(Click Picture To Enlarge)
(Click Picture To Enlarge)
(Click Picture To Enlarge)
(Click Picture To Enlarge)
(Click Picture To Enlarge)
The objective of this study was to investigate the behaviour of a number of physical and biological parameters in the Fal estuary. Analysis of the data has revealed that tidal influence was one of the key factors controlling these variables.
There are a number of limitations that need to be considered regarding the data presented herein. One issue faced with the use of contour plots is the possibility of temporal aliasing. At the beginning of the time series, the water column was only 2 m deep as it was shortly after low tide. However, the Sigmaplot software still generated temperature patterns for depths beyond this. This is false and despite being deleted on the graphs presented, it may still cause distortion to the surrounding data points. Furthermore, members of the public actively use King Harry Pontoon and, as such, sampling was disturbed by the passage of canoes and a tourist boat on several occasions. An anthropogenic influence on the data, therefore, can not be ruled out. In order to develop a more accurate understanding of these trends, one should aim to include the data of other research groups to generate a longer time series.