
Information
Contents
DISCLAIMER: The words and views expressed here solely represent the findings made by this group and by no means those of the University of Southampton.
Date: 25th June 2016
Time (GMT): 07:00 to 11:00
Low Tides (GMT): 02:23, 14:40
High Tides (GMT): 08:14, 20:31
Tidal Range: 3.7m
Weather Conditions: 6/8ths cloud coverage and slight rain at departure. Cloud coverage increased to 8/8ths.
Side Scan Sonar
Four transects were undertaken aboard MTS Valonia with a subsurface dual analogue side scan sonar in order to remotely map the sea floor. The reflected sounds received by the side scanner created a high resolution trace image (410hHz) with a swath range of 75 m, layback of 15 m and tow fish depth between 2 m and 3 m. The resultant trace image was analysed in the laboratory on the 26th June 2016.
Camera Operation
An underwater camera attached to a stabilizing platform was deployed and the vessel was allowed to drift naturally across the survey site. A constant distance above the seafloor was maintained through radio contact between the deployment and observation teams.
Footage Quantification
The subsequent footage was edited within VLC media player to optimise the pigmentation and resolution in order to make species clearer and easier to identify. Screenshots were taken at one minute intervals and their location was noted. These were then further processed and added to a 10x10 grid to improve quantification of features, such as sediment type, bedforms and biology. Furthermore, the footage was slowed to a quarter of its original speed in order to assist in species identification.
Creation of Habitat Map
In the laboratory, the side scan trace was divided according to the transects undertaken. These were lined up next to each other and the four boundary zones were identified. The fish height and slant range were measured and then converted to the true horizontal distance to provide an accurate dimension of each boundary in metres. Side scan correction equations were used to quantify the length and height of the observed bedforms. Surfer software was used to plot time and position of each transect. The four boundaries, video tracks and Van Veen grab location were added to this plot to generate a habitat map.
There was a relatively constant sediment structure. Four clear boundaries could be identified in the survey area. There is a weak trend of progression with these points of interest in line with the vertical profile of the map. Boundary 4 consisted of relatively fine sand and there was an unusually abrupt change in sediment composition to boundary 2. This is indicative of a paleo-river channel, which is possible because Falmouth Bay is a ria that was formed when sea levels rose at the end the last ice age, 11,000 years ago (Goudie & Gardner, 1992). However, a sub-surface profiler would be needed to confirm this speculation. On the other hand, these observations may be the result of a boat wake interfering with the backscatter.
The two video tracks revealed that biodiversity and abundance of flora and fauna was limited. However, the small amount of video footage prevents a more advanced analysis. Future studies should aim to undertake more video transects in order to provide a more accurate representation of the biology present. There were a number of issues with the underwater camera, for example, lack of resolution and size distortion. This could be improved through use of a higher quality camera and a lighting system.
The Van Veen grab supported the conclusions drawn from the other sampling mediums. However, only a single grab sample was taken. One improvement upon this would be to take more grabs dispersed throughout the survey area in order to more accurately ground truth the data.
The findings presented herein are consistent with those of those of previous University of Southampton groups. Comparison to past data sets would allow some assessment of system recovery in Falmouth Bay.
- Al & Helford SAC Management Scheme, (2005) Fal & Helford Special Area of Conservation Management Scheme, available at: www.publications.naturalengland.org.uk/file/3118614, [accessed 30th June 2016]
- Goudie, A., Gardner, R., (1992) Fowey ria and the drowned coastline of Cornwall. In: Discovering Landscape in England & Wales, pp. 164-165, Springer, Netherlands.
|
Transect |
Latitude (Start) |
Longitude (Start) |
Time GMT (Start) |
Latitude (End) |
Longitude (End) |
Time GMT (End) |
|
1 |
50° 07.927’ N |
005° 04.470’ W |
08:16:48 |
50° 06.904’ N |
005° 05.133’ W |
08:27:43 |
|
2 |
50° 06.908’ N |
005° 05.036’ W |
08:29:00 |
50° 07.936’ N |
005° 04,378’ W |
08:40:24 |
|
3 |
50° 07.861’ N |
005° 04.314’ W |
08:42:13 |
50° 06.841’ N |
005° 04.984’ W |
08:52:54 |
|
4 |
50° 06.867’ N |
005° 04.890’ W |
08:54:19 |
50° 07.886’ N |
005° 04.231’ W |
09:05:30 |
|
Video |
Latitude (Start) |
Longitude (Start) |
Time GMT (Start) |
Latitude (End) |
Longitude (End) |
Time GMT (End) |
|
1 |
50° 07.854’ N |
005° 04.475’ W |
09:21:40 |
50° 07.710’ N |
005° 04.367’ W |
09:39:35 |
|
2 |
50° 07.488’ N |
005° 04.786’ W |
09:45:56 |
50° 07.701’ N |
005° 04.709’ W |
09:56:05 |
|
Van Veen Grab |
Latitude |
Longitude |
Time GMT |
|
|
|
|
1 |
50° 07.306’ N |
005° 04.618’ W |
10:03:23 |
|
|
|
Figure 17: table of starting and ending latitudes, longitudes and times (GMT) for the four transects and the van veen grabs and videos.
(Click Picture To Open PDF In A New Tab)
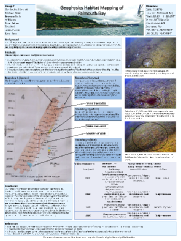
Figure 18: Geophysics Habitat Mapping Poster.
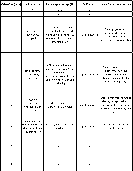
Figure 9: habitat mapping table summarizing the major findings in video #1 with the respective times.
Recording start time: 09:21:40 GMT
Northings:30174.2
Eastings:180361.4
Recording Time End:09:39:35 GMT
Northings: 29903.5
Eastings: 180478.2
(Click Picture To Open PDF In A New Tab)
The objective of this practical was to map an area of the seafloor in Falmouth Bay. A similar survey has been carried out in the same area by other University of Southampton groups for a number of years. This has been done in order to assess the recovery of the system since its designation as a Special Area of Conservation (SAC). Invasive anthropogenic activities, such as dredging, are prohibited in this zone to protect the vulnerable habitats, including seagrass and maerl beds (Al & Helford SAC Management Scheme, 2005). Side-scan sonar deployed from MTS Valonia was used to map the seafloor. This was supported by ground truthing in the form of video tracks and Van Veen grab samples to confirm any identified patterns.
Van Veen Grab
A single grab samples was taken, which consisted of maerl, coarse sand and bivalve remains. The sample was consistent with the findings of the side scan and video transects.
Habitat Map
Analysis of the video transects revealed there was limited biodiversity with the same species present in the same proportions in both transects. The majority of sediment was coarse sand. The habitat map indicated that four distinct regions were present within the survey area. These included a small rocky outcrop and three types of sands, some of which were characterised by dunes.
Boundary 1 (brown):
A region of stronger return indicating either a rocky outcrop or a patch of macro algae.
Boundary 2 (orange):
This area, which accounted for the majority of the survey area, consisted of uniform dune bedforms formed from coarse sand. These were small dunes with a out-of-phase catenary transverse shape and a height of 0.21 m. The mean length of the ripples was 0.58 m.
Boundary 3 (yellow):
This area was formed from smaller sand grains and showed no evidence of any bedforms. These fine sands repeatedly interrupt the bedforms of coarse sands (boundary 2) thereby creating alternating bands of fine to coarse sediments.
Boundary 4 (blue):
This region is consisted of finer sand. There is an abrupt change from boundary 2 to boundary 4 which is indicated by a sudden change in backscatter.
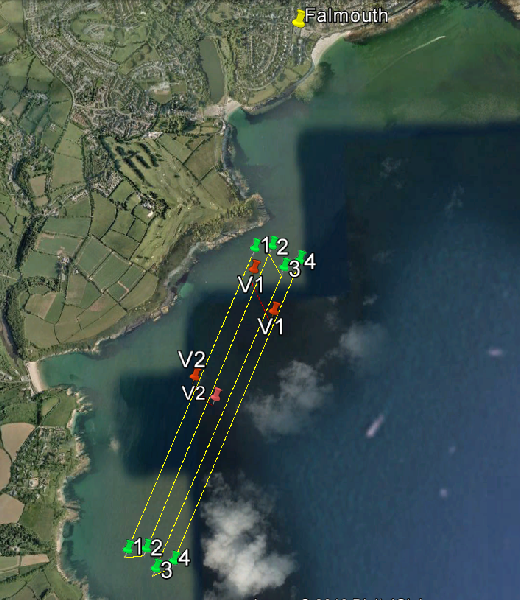
Figure 16: map of Falmouth and the surrounding coastline.
Falmouth is marked by the yellow pin.
Sonar transects are show as a yellow line with a start and end position marked by a green pin labelled “1, 2, 3 or 4” depending on the transect.
Video paths are shown as an orange path with a start and end position marked by an orange pin labelled “V1 or V2”.
(Click Picture To Enlarge)
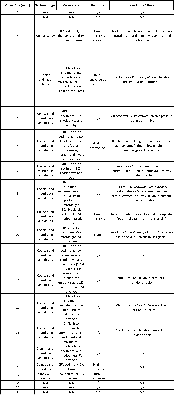
Figure 20: habitat mapping table summarizing the major findings in video #2 with the respective times.
Recording start time: 09:45:56 GMT
Northings:29511.2
Eastings:179962.0
Recording Time End:09:56:05 GMT
Northings: 29903.5
Eastings: 180070.6
(Click Picture To Open PDF In A New Tab)
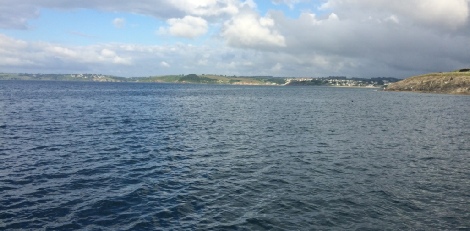
Figure 15: survey site for habitat mapping.